


INTRODUCTION
Pediatric obesity has become a global public health problem because of its increasing prevalence [1-6]. The World Health Organization estimated that the global incidence of pediatric obesity is expected to increase from 42 million cases in 2013 to 70 million cases by 2025 [7]. In Japan, the incidence of pediatric obesity increased two-three times within 30 years until 2000 [7,8]. Although the total number of children with obesity has decreased since 2006 because of obesity prevention measures, children with obesity constitute approximately 10% of the pediatric population and the percentage of children with high obesity rate has not decreased [7]. Pediatric obesity has a high probability of transitioning to adult obesity. In addition, pediatric obesity is a risk factor for metabolic syndrome and other health problems such as hypertension, type 2 diabetes mellitus, non-alcoholic fatty liver disease (NAFLD), dyslipidemia, and accelerated atherosclerosis [5,8]. Therefore, it is important to address the problem of pediatric obesity from an early stage; hence, preventive measures against lifestyle-related diseases are being undertaken during health checkups [7]. In addition to promoting lipolysis, exercise is associated with improved insulin sensitivity, improved cardiopulmonary function, decreased risk of NAFLD, and improved chronic inflammatory status. In particular, exercise habits are strongly correlated with metabolic syndrome [1,9]. According to Oguri et al., compared with children who do not exercise, children who exercise continuously have a significantly lower risk of metabolic syndrome and lower visceral fat even if they are obese, which indicates the effectiveness of exercise [10].
Sumo wrestling, a competitive sport performed in an circle of 4.55 m diameter, has been practiced in Japan since ancient times [11]. It is advantageous to have heavy body weight to increase the difficulty of being pushed out of the circle. Moreover, these athletes require body fat to cushion the impact of tackling and to prevent trauma. Thus, bodybuilding is directly linked to the prevention of trauma and improved performance. However, sumo wrestlers follow a diet to increase the body size from childhood, putting them at risk for lifestyle-related diseases such as type 2 diabetes mellitus and dyslipidemia [12,13]. Professional adult sumo wrestlers are a unique group of athletes because they have high physical activity levels despite being overweight; however, they are at risk for hypertension, hyperlipidemia, and glucose intolerance because of obesity [12,13]. Sumo wrestlers have a high resting energy expenditure because of large organ and tissue masses [14]; hence, to compensate for their large body size, their energy intake is more than their energy expenditure. Given the long span of positive energy balance, high energy intake may lead to the accumulation of visceral fat and metabolic syndrome despite high energy expenditure [13]. Weight is correlated with health problems. The prevalence of dyslipidemia and hypertension is significantly higher among sumo wrestlers compared with healthy male individuals in the general population13. However, the risk of metabolic syndrome in sumo athletes during childhood is unclear.
This study compared junior sumo wrestlers and children with obesity to identify the parameters associated with the risk of metabolic syndrome to facilitate the implementation of supportive medical measures and thereby enable continuous participation in competitions, while maintaining good health and increasing body size during growth and development in childhood.
METHODS
Participants and experimental protocol
This study enrolled 14 male children (age: 9-17 years; sumo experience mean: 4.7 ± 1 years; medical history: asthma [n = 5] and allergy [n = 5]) from a local sumo wrestling club (sumo group). This group included nine designated certified prefectural athletes who were proficient to participate in the national tournament in Japan. Moreover, we enrolled 56 male children (age: 9-14 years) who were diagnosed with primary or simple obesity in an pediatric obesity outpatient clinic of a hospital between 2012 and 2020. Children diagnosed with primary obesity or simple obesity were included in the study, whereas those diagnosed with hereditary obesity, obesity and endocrine disorders, or symptomatic obesity were excluded. Participants were divided into two groups based on voluntary exercise levels: participants who voluntarily joined a sports club (baseball, soccer, track and field, table tennis, swimming, tennis, judo, or basketball) and performed cohesive exercise for ≥60 minutes at least once a week for >1 year in addition to the physical education class in school were assigned to the other sports group (n = 28) and participants who did not exercise were included in the non-exercise group (n = 28).
The study protocol and procedures were explained to all participants. Children from the sumo wrestling club provided written informed consent for each procedure. An optout opportunity was provided to children diagnosed with obesity, and children who did not consent to participate were excluded from this study. This study was conducted in accordance with the ethical principles of the Declaration of Helsinki and was approved by the Institutional Review Boards of the Faculty of Health and Sports Sciences of University of Tsukuba and Nasu Red Cross Hospital (Ref Nos. Tai 019-156, Tai 019-155, and 2019-14, respectively).
The evaluation of physical parameters and collection of early morning fasting blood samples of the sumo group participants were performed at the Sumo Training Center. Data of the other two groups were obtained from the medical records of the first clinic visit of the participants.
Anthropometric measurements
Height was measured using a stadiometer (DST-210S, Muratec-KDS Corp., Kyoto, Japan). Body weight was measured using a digital scale (DST-210S, Muratec-KDS Corp., Kyoto, Japan; Tanita MC780A-N, Tanita, Tokyo, Japan) with the participants wearing light clothing. Waist circumference was measured at the height of the navel using a non-stretch measuring tape (SP-715, Sekisui Jushi Corp., Osaka, Japan). The waist to height ratio was calculated from the waist circumference and height. The guidelines for the treatment of pediatric obesity and the diagnostic criteria for pediatric metabolic syndrome recommend a waist to height ratio of ≥0.5 as the diagnostic criterion for pediatric obesity [7].
Body mass index (BMI) was calculated from height (cm) and weight (kg), and the BMI z-score was calculated from the average and standard deviation of the BMI stratified by age according to the guidelines of the Japanese Society for Pediatric Endocrinology [15]. The obesity rate (%) was calculated as follows: ([body weight − ideal body weight]/ideal body weight) × 100. Based on the obesity rate, participants were categorized as follows: 20%-30%, mildly obese; 30%-50%, moderately obese; and >50%, highly obese. The ideal body weight was determined from the school health statistics reported in accordance with the requirements of the Ministry of Education, Culture, Sports, Science, and Technology in Japan [7].
Blood pressure measurement
Blood pressure was measured at rest in the sitting position using an automated blood pressure monitor with a cuff width of at least 40% of the upper arm circumference (Omron HBP-1300, Omron Corp., Kyoto, Japan). Hypertension was diagnosed according to the pediatric metabolic syndrome diagnostic criteria (a systolic blood pressure [SBP] of ≥125 mmHg and/or a diastolic blood pressure [DBP] of ≥70 mmHg) [7].
Blood biomarkers
To identify blood biomarkers for metabolic syndrome, fasting venous blood samples were analyzed. Participants were asked to skip breakfast to obtain fasting venous blood samples for the measurement of lipid profile parameters (such as total cholesterol [TC], low-density lipoprotein-cholesterol [LDL-C], high-density lipoprotein-cholesterol [HDL-C], non-high-density lipoprotein-cholesterol [non-HDL-C], and triglyceride [TG]) as well as fasting blood glucose and glycated hemoglobin (HbA1c) levels as the indicators of glucose tolerance. The analysis of blood samples was outsourced to a local clinical laboratory (Nasu Red Cross Hospital and Tsukuba i-Laboratory).
The lipid indices and glucose tolerance were evaluated according to the guidelines for pediatric obesity and the diagnostic criteria for pediatric metabolic syndrome. Impaired glucose tolerance was defined as a fasting glucose level of ≥ 100 mg/dL and/or HbA1c ≥6.5 %, and dyslipidemia was defined as the presence of one or more of the following conditions: TC, ≥220 mg/dL; HDL-C ≤40 mg/dL, non-HDL-C ≥ 150 mg/dL, and TG ≥120 mg/dL. The LDL-C cutoff (the 95th percentile) in 6-18-year-old children was ≥140 mg/dL [7].
Statistical analysis
Analyzed data are presented as mean ± standard deviation (SD). The Kolmogorov-Smirnov test was used to assess the normality in the distribution of the parameters. In the case of non normal distribution of parameters, the test was applied to logarithmically transformed values. Intergroup differences were evaluated using the analysis of covariance (ANCOVA) after adjusting for age, when prerequisites for using ANCOVA were satisfied. For normally distributed data, where ANCOVA could not be performed, one-way analysis of variance (ANOVA) was used. In the case of non-normally distributed data or failure to meet assumptions underlying ANCOVA or ANOVA, the non-parametric Kruskal-Wallis test was used for intergroup comparisons. When the Variables showing significant intergroup differences in the Kruskal-Wallis test were analyzed using the Mann-Whitney U test with Bonferroni correction. The difference in reference values was determined using the one-sample t-test or Wilcoxon test. Statistical analyses were performed using IBM SPSS Statistics for Windows (version 23.0; IBM, New York, NY, USA). A p value of <0.05 was considered statistically significant.
RESULTS
Intergroup differences in SBP (a normally distributed variable) were analyzed using ANCOVA after adjusting for age. Variables such as TC, LDL-C, and non-HDL-C did not meet the criteria for ANCOVA and were analyzed using ANOVA. The prerequisites for ANCOVA were assessed with age as a covariate for HDL-C, TG, and blood glucose, which were found to be normally distributed after logarithmic transformation. However, ANCOVA was not performed because these variables did not satisfy the assumptions of linearity and homogeneity of the regression slopes. The other variables such as height, weight, BMI, waist to height ratio, waist circumference, DBP, and HbA1c were not normally distributed even after logarithmic transformation. Therefore, the non-parametric Kruskal-Wallis test was used for intergroup comparisons of data that were non-normally distributed or did not satisfy the assumption for ANCOVA (e.g., such as body size, DBP, HDL-C, TG, blood glucose, and HbA1c).
Anthropometric parameters
The physical characteristics of the participants are listed in Table 1. The height and body weight of the sumo group were significantly higher than those of the other two groups. The BMI, BMI z-score, and obesity rate were significantly higher in the sumo group than in the other sports group. However, no significant difference was found between the sumo group and non-exercise group. Waist circumference was significantly higher in the non-exercise and sumo groups than in the other sports group; however, no significant difference was found in waist circumference between the non-exercise and sumo groups. Furthermore, the waist to height ratio was significantly higher in the non-exercise group than in the other sports group.
Blood pressure and biomarkers
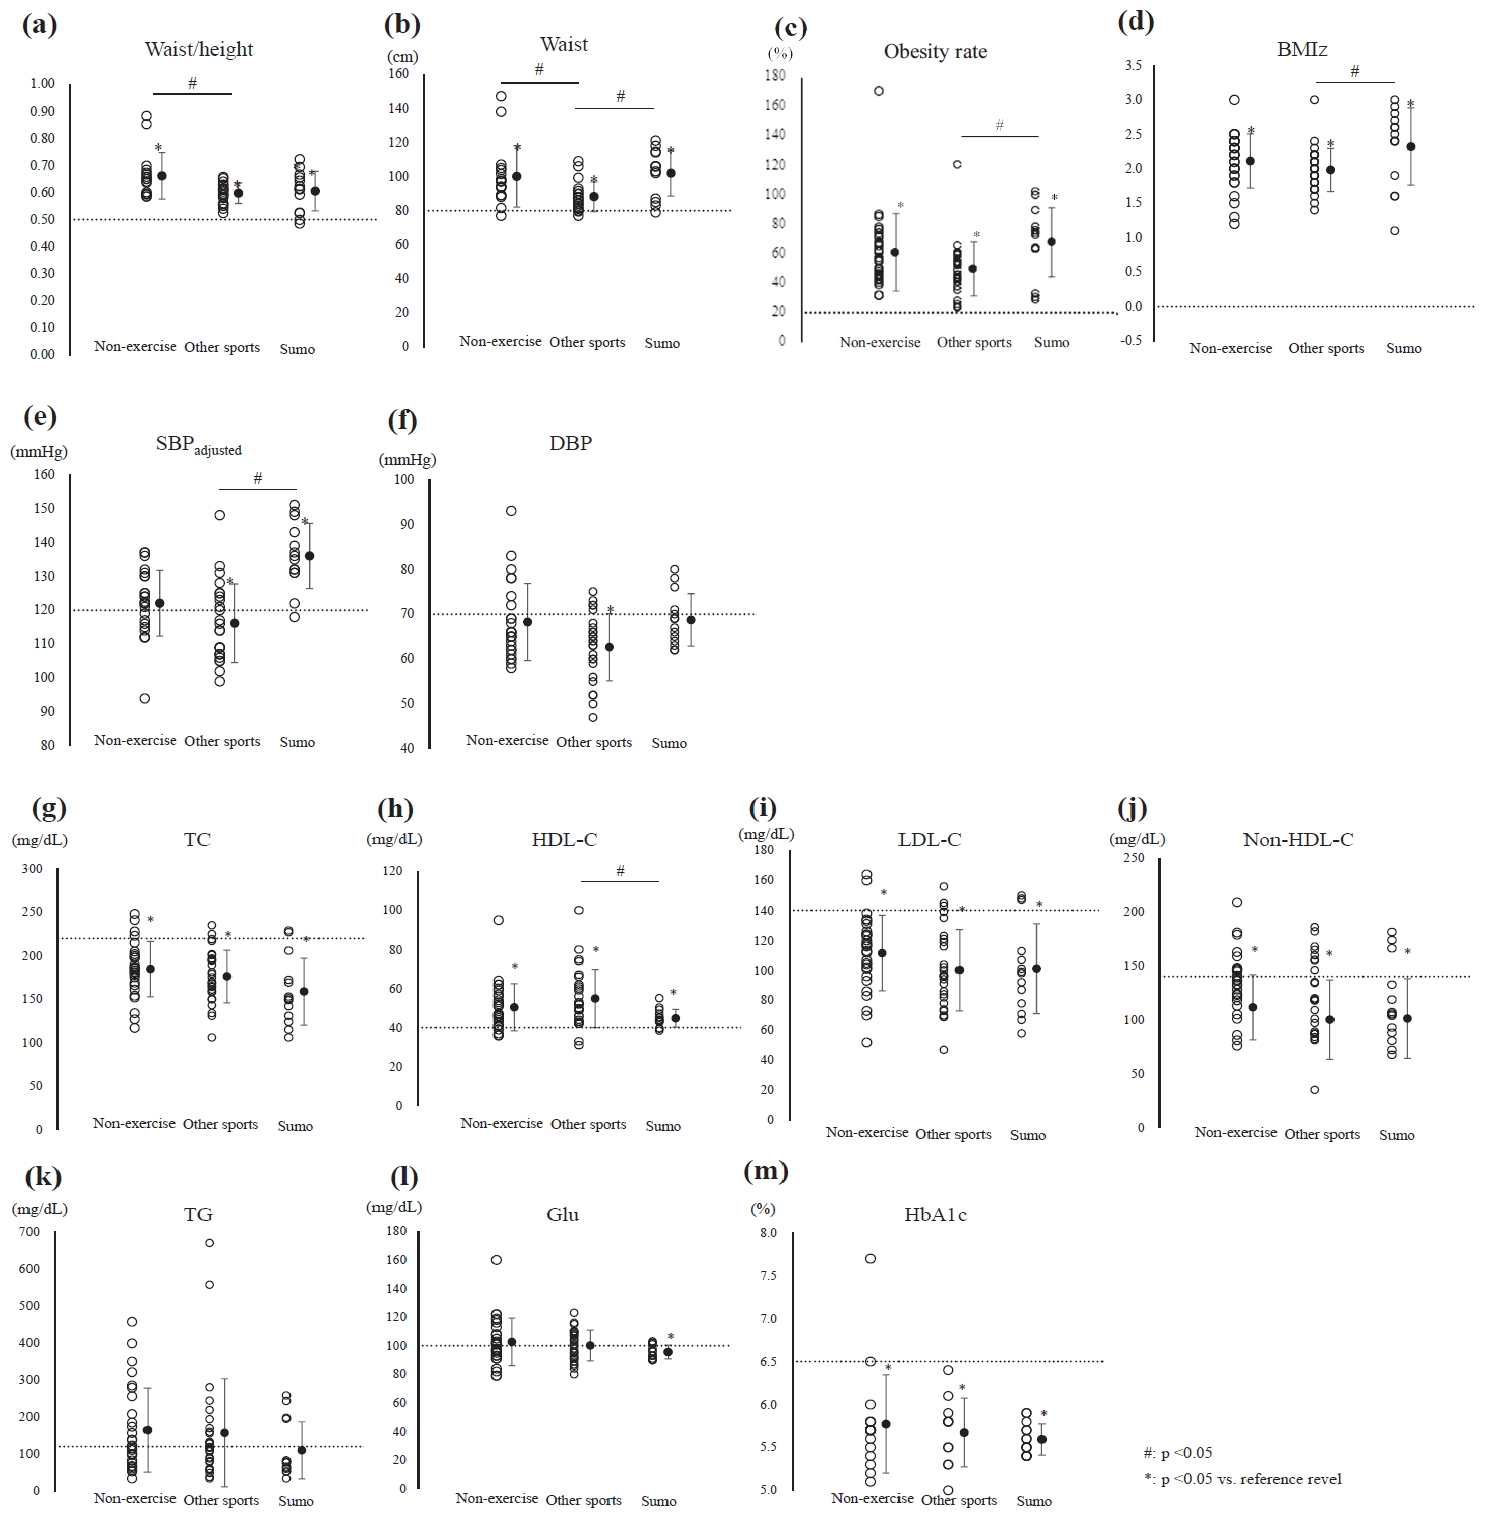
The values of blood pressure and biomarkers are presented in Table 2. SBP was significantly higher in the sumo group than in the non-exercise and other sports groups; however, after adjusting for age, no significant difference was found in SBP between the sumo and non-exercise groups. SBP was lower than the reference value in the other sports group (≥125 mmHg, effective size [ES] = 0.76, p < 0.01; Figure 1a, Table 3). After Bonferroni correction, no significant intergroup difference in DBP was detected. DBP was lower than the reference value in the other sports group (≥70 mmHg, ES = 0.98, p < 0.01; Figure 1b, Table 3).
The TC, LDL, non-HDL, and TG levels did not significantly differ among the three groups. Moreover, the TC, LDL-C, and non-HDL-C were significantly lower thanthe reference values in all the study groups (TC: ≥220 mg/dL, LDL: ≥140 mg/dL, non-HDL: ≥150 mg/dL; Figure 1b, Table 3); however, the TG level was higher than the reference value in the non-exercise and the other sports groups. On the contrary, the TG level was lower than the reference value in the sumo group (≥120 mg/dL; non-exercise group: ES = 0.22, p = 0.259; other sports group: ES = 0.26, p = 0.196; sumo group: ES = 0.13, p = 0.638; Figure 1b, Table 3). The HDL-C level was significantly lower in the sumo group than in the other sports group. The HDL-C level was within the normal range in the sumo group (≥40 mg/dL, ES = 1.06, p < 0.01; Figure 1b, Table 3).
DISCUSSION
In this study, the risk of health problems related to obesity was examined based on anthropometric indices, blood pressure, and biochemical data and the factors associated with metabolic syndrome were compared among the three study groups: sumo group, non-exercise group, and other sports group. Although the body size of participants was larger in the sumo group, no obvious abnormality in the lipid indices and glucose tolerance was noted. The blood glucose level was significantly lower than the reference value only in the sumo group. SBP was significantly lower in the other sports group, which indicated the positive effect of exercise; however, SBP was higher than the reference value in the sumo group, which was attributed to the effect of being overweight and having athletic characteristics requiring dynamic muscle strength. Based on the body size, 79% of junior sumo athletes are highly obese (obesity rate: ≥50%), placing them at a high risk for health problems. However, sumo wrestlers diagnosed with obesity based on physical examinations in school are reluctant to seek medical attention. Participants in the sumo group engaged in higher-intensity exercise, and therefore, the risk of metabolic syndrome in the sumo group was lower than that in the other two groups, which may compensate for the risk of obesity-related health problems.
Height, weight, and BMI were higher in the sumo group, but the effect of age was considered to be strong. Therefore, the BMI z-score and obesity rate, which incorporate the standard weight for each sex and age, were used for comparison and were significantly higher in the sumo group than in the other sports group, indicating that the sumo group maintained a larger body size. The waist circumference was larger in the sumo and non-exercise groups compared with the other sports group. Brown et al. reported that waist circumference reduced as obesity and visceral fat mass decreased with exercise in children with obesity [16]. Furthermore, exercise has been shown to reduce abdominal fat, especially visceral fat [5,17]. The lower waist circumference and waist to height ratio in the other sports group in this study suggest that continuous exercise prevents or reduces visceral fat accumulation. Conversely, the waist circumference in the sumo group was larger than that in the other sports group, although participants of the sumo group performed higher intensity exercises than the participants of the other sports group. In sumo wrestling, higher body weight is considered advantageous because it decreases the chances of being thrown out of the ring. Moreover, to buffer the impact of collisions between athletes and to prevent trauma, it is speculated that greater fat accumulation and larger waist circumference are athletic characteristics that confer advantages with regard to the performance of sumo wrestlers.
In this study, SBP was higher in the sumo group than in the other sports group and lower in the other sports group than in the sumo and non - exercise group. In the presence of obesity, increased circulating blood volume contributes to increased blood pressure [7]. Moreover, a strong association between body size and blood pressure has been reported [2,3]. Furthermore, obesity-induced adipocyte hypertrophy increases insulin resistance by decreasing adiponectin secretion [7,18]. In addition, it increases sympathetic nervous system tone [2,7] through hyperleptinemia due to leptin resistance, which increases blood pressure. However, these factors are expected to improve with exercise habits. Physical activity reduces the risk of hypertension and atherosclerosis [3,19], which is consistent with the lower blood pressure in other sports group. Conversely, many reports have indicated a higher risk of hypertension in athletes with obesity [19,20]; moreover, hypertension in student athletes is strongly correlated with increased obesity [21,22]. Therefore, we speculated that the sumo group was at risk for hypertension because of a high BMI z-score and obesity rate.
Regarding the relationship between athletic characteristics and blood pressure, the frequency of hypertension was reported to be high in American football linemen [22] and high-intensity resistance training was considered to be one of the risk factors for hypertension [23]. Athletes who undertake strength training have a higher blood pressure than athletes who primarily perform endurance training, and athletes who train >10 hours per week have a high blood pressure [24], which is consistent with the results in the sumo group. In professional wrestlers, blood pressure increases with weight gain, indicating the onset of irreversible changes caused by being overweight [25]. Physical activity has a blood pressure- lowering effect; moreover, exercise therapy lowers blood pressure [24]. For athletes who are overweight, the risk factors of hypertension in overweight athletes are obesity and power sports [23,25]. Thus, the athletic characteristics of sumo, such as intentional overweight and strength training, as well as obesity and high BMI z-scores, were considered to be risk factors for hypertension. Sports played by participants of the other sports group (such as baseball, soccer, table tennis, and swimming) were less likely to cause high blood pressure, as reported in previous studies. Therefore, it was presumed that blood pressure was not elevated in the other sports group as in the sumo group, which is a power competition [23,24]. Pediatric hypertension not only has a high rate of progression to essential hypertension in adulthood [7], but also promotes the inception of atherosclerotic pathogenesis in children with obesity at an early age. Therefore, it is important to promote a healthy diet and lifestyle early in childhood [6,17].
The mean lipid levels, except for the HDL-C level, were lower in the sumo group than in the other two groups, although the difference was not significant. A study of college judo athletes reported that in athletes with high body fat, the lipid levels were within the normal range and were compensated for by physical activity [26]. However, in a study of Japanese collegiate American football players, highly obese linemen had significantly higher LDL-C and TG levels and significantly lower HDL-C levels than the backs, which indicates the effect of obesity on lipid metabolism [27]. In professional sumo wrestlers aged >20 years, HDL-C decreases with an increase in obesity [28]. Furthermore, Kropa et al. performed a longitudinal study of athletes and reported that childhood obesity was associated with low HDL-C levels in adulthood [21]. Therefore, although we did not find obvious lipid abnormalities in the sumo group in this study, the results of previous studies suggest a risk of progression to dyslipidemia and atherosclerosis in the future.
In the sumo group, blood glucose levels were significantly lower than the reference value, which was attributed to the effects of exercise and muscle mass. There are two types of exercise effects: acute and chronic. Anaerobic exercises such as strength training improve glucose metabolism by increasing skeletal muscle mass [18]. The acute effect is the only effect of exercise on blood glucose uptake and lowering of blood glucose level [18]. Exercise causes skeletal muscles to contract, which leads to the consumption of adenosine triphosphate (ATP) in the muscle tissue, resulting in increased ATP production in the muscles [18]. This action activates adenosine monophosphate-activated protein kinase, which promotes the translocation of intracellular glucose transporter type 4 (GLUT4) to the surface of the cell membrane [29]. Consequently, the uptake of glucose in the blood is enhanced, leading to decreased blood glucose levels [7,30]. The chronic effects of exercise translate to improved insulin resistance with continued exercise [21], which involves increased expression of GLUT4, increased muscle mass, and changes in the muscle fiber type [18]. The sumo group was thought to have large muscle mass because of continuous exercise; hence, we inferred that the promotion of carbohydrate uptake by skeletal muscles contributed to the maintenance of low glycemic levels.
The sumo group is a specific group of athletes and therefore, the number of participants is limited; hence, they could not be matched with the group of children with obesity according to average age. However, according to the Japanese guidelines for the management of obesity in children and adolescents [7], the range of childhood obesity based on age is 6-18 years; hence, we compared children of this age group in this study. The statistical analysis in this study was limited by the small sample size. Further studies using data classified by age group or adjusted for age are warranted. The waist circumference was larger in the sumo group compared with the other two groups, but problems remain with regard to the relationship between body composition and lipid metabolism, and glucose tolerance in sumo group. Therefore, detailed evaluation of the skeletal muscle mass and visceral fat mass in each body part should be performed. In addition to exercise, dietary habits and family history strongly influence hypertension. Particularly, the effect of dietary salt intake on hypertension should be investigated [30]. Sumo wrestlers maintain their physique while performing high-intensity exercises; hence, it is presumed that these wrestlers consume more calories than the energy used to maintain their physique. Thus, energy balance and metabolism should be considered in health management.
CONCLUSION
The body size of junior sumo wrestlers was larger than that of children with obesity. Blood biochemistry revealed that the lipid levels in the sumo group were within the normal limits. However, the HDL-C level was significantly lower in the sumo group than in the other sports group, suggesting that HDL-C is an important target for preventing the progression to atherosclerotic disease. Glucose tolerance is a parameter that may be compensated for by continuous exercise and increased skeletal muscle mass; therefore, the blood glucose level was lower in the sumo group. Blood pressure was high in the sumo group, even after adjusting for age, which may be because of the overweight physique and athletic characteristics of the sumo participants. Thus, the health of junior sumo wrestlers should be monitored carefully.