


INTRODUCTION
Regular physical activity is a very important factor for overcoming obesity, along with the control of diet intake and lifestyle changes [1]. Physical activity and exercise are effective in increasing energy metabolism, with lipids and carbohydrates serving as the two main fuels for sustaining oxidative metabolism. Reduction in fat oxidation has been reported to be associated with insulin resistance and metabolic diseases [2,3]. Activation of lipid metabolism is used to treat obesity, and results in improvement of blood lipids, regulation of energy balance via hormones, maintenance and loss of weight, reduction of body fat, improvement of cardiovascular function, and prevention of oxidative damage to tissues [4].
Exercise improves physical function, can be performed by all age groups without risk of injury, and has advantages in effectiveness and safety [5]. Despite these advantages, considerable time and high intensity are required to obtain the required amount of activity within a limited time, and methods to increase energy consumption are being sought [6,7]. The energy substrate is evaluated as a method for measuring energy expenditure, and is affected by several factors, such as gender and exercise intensity. Energy oxidation through exercise can be estimated by measuring fat and carbohydrate oxidation rates using indirect calorimetry, and the determination of carbohydrate and fat oxidation rates at rest and during exercise can provide important information for the prescription of exercise programs [8].
It has been reported that speed and gradient can be adjusted to increase energy consumption [9], and that the increase in energy consumption during walking can linearly increase metabolic requirements as external weights increase [10]. These external loads increase metabolic consumption only when they are >20% of their weight, and increasing weight and walking speed increases muscle activity and muscle fatigue, which are reported to cause injuries due to increased load and pressure on the patients knees and ankles [11]. Lelas et al. [12] reported that an increase in walking speed increases the knee joint load, and that obesity, compared with normal weight, causes a greater knee joint load. M├╝ndermann et al. [13] reported that the vertical ground reaction peak was highest at 0┬░ during 0┬░, 5┬░, and 10┬░ walking at equal speeds, increasing the likelihood of osteoarthritis and the risk of acute musculoskeletal injury.
To reduce the risk of osteoarthritis and acute musculoskeletal injury [14], low-speed aerobic exercise is recommended; however, since energy consumption is also low at low speed, uphill climbing is recommended as a strategic method to increase energy consumption [15]. In addition, it was also reported that moderate incline walking of 10┬░ or less increased metabolic rate compared with horizontal (0┬░) walking at an equal speed [16]. Using the ACSM standard formula, it was reported that walking at a 6┬░ gradient at a speed of 0.75 m┬Ęs-1 and aerobic exercise at a 0┬░ gradient at a speed of 1.50 m┬Ęs1 elicit similar moderate-intensity (VO2max, 40-60%) physiological and metabolic responses [17]. As such, it seems necessary to study how the change in speed according to age affects energy consumption and energy metabolism on flat land and a gradient of 6┬░, and it is judged that this could be used as basic data for public health.
As described above, to design a safe and effective walking exercise program in terms of public health, it is important to understand energy consumption and energy metabolism based on inclination and intensity. However, most studies on aerobic exercise simply compare the energy consumption by increasing the speed, and studies analyzing the combination of the gradient and intensity are insufficient. Therefore, this study attempted to investigate the effects of gradient and age on womenŌĆÖs energy expenditure and metabolic variables during aerobic exercise of equal intensity.
METHODS
Participants
The participants included 30 healthy Korean women in their 20s (n=15) and 50s (n=15). Physical characteristics of the participants are presented in Table 1. The participant selection criteria were as follows: 1) non-smokers, 2) those without cardiovascular disease, musculoskeletal disease, or metabolic disease, and 3) those who had no problems participating in the exercise test. They participated repeatedly according to the random order for 0% gradient and 6% aerobic exercise, and the effect of the previous test on the next test was minimized by leaving an interval of 7 days between the two tests. We explained the experiments and possible side effects to all participants prior to the start of the study and obtained their written consent for participation. This study was approved by the Institutional Review Board (KHSIRB 2015-009) and conducted in accordance with the provisions of the Declaration of Helsinki.
Experimental design
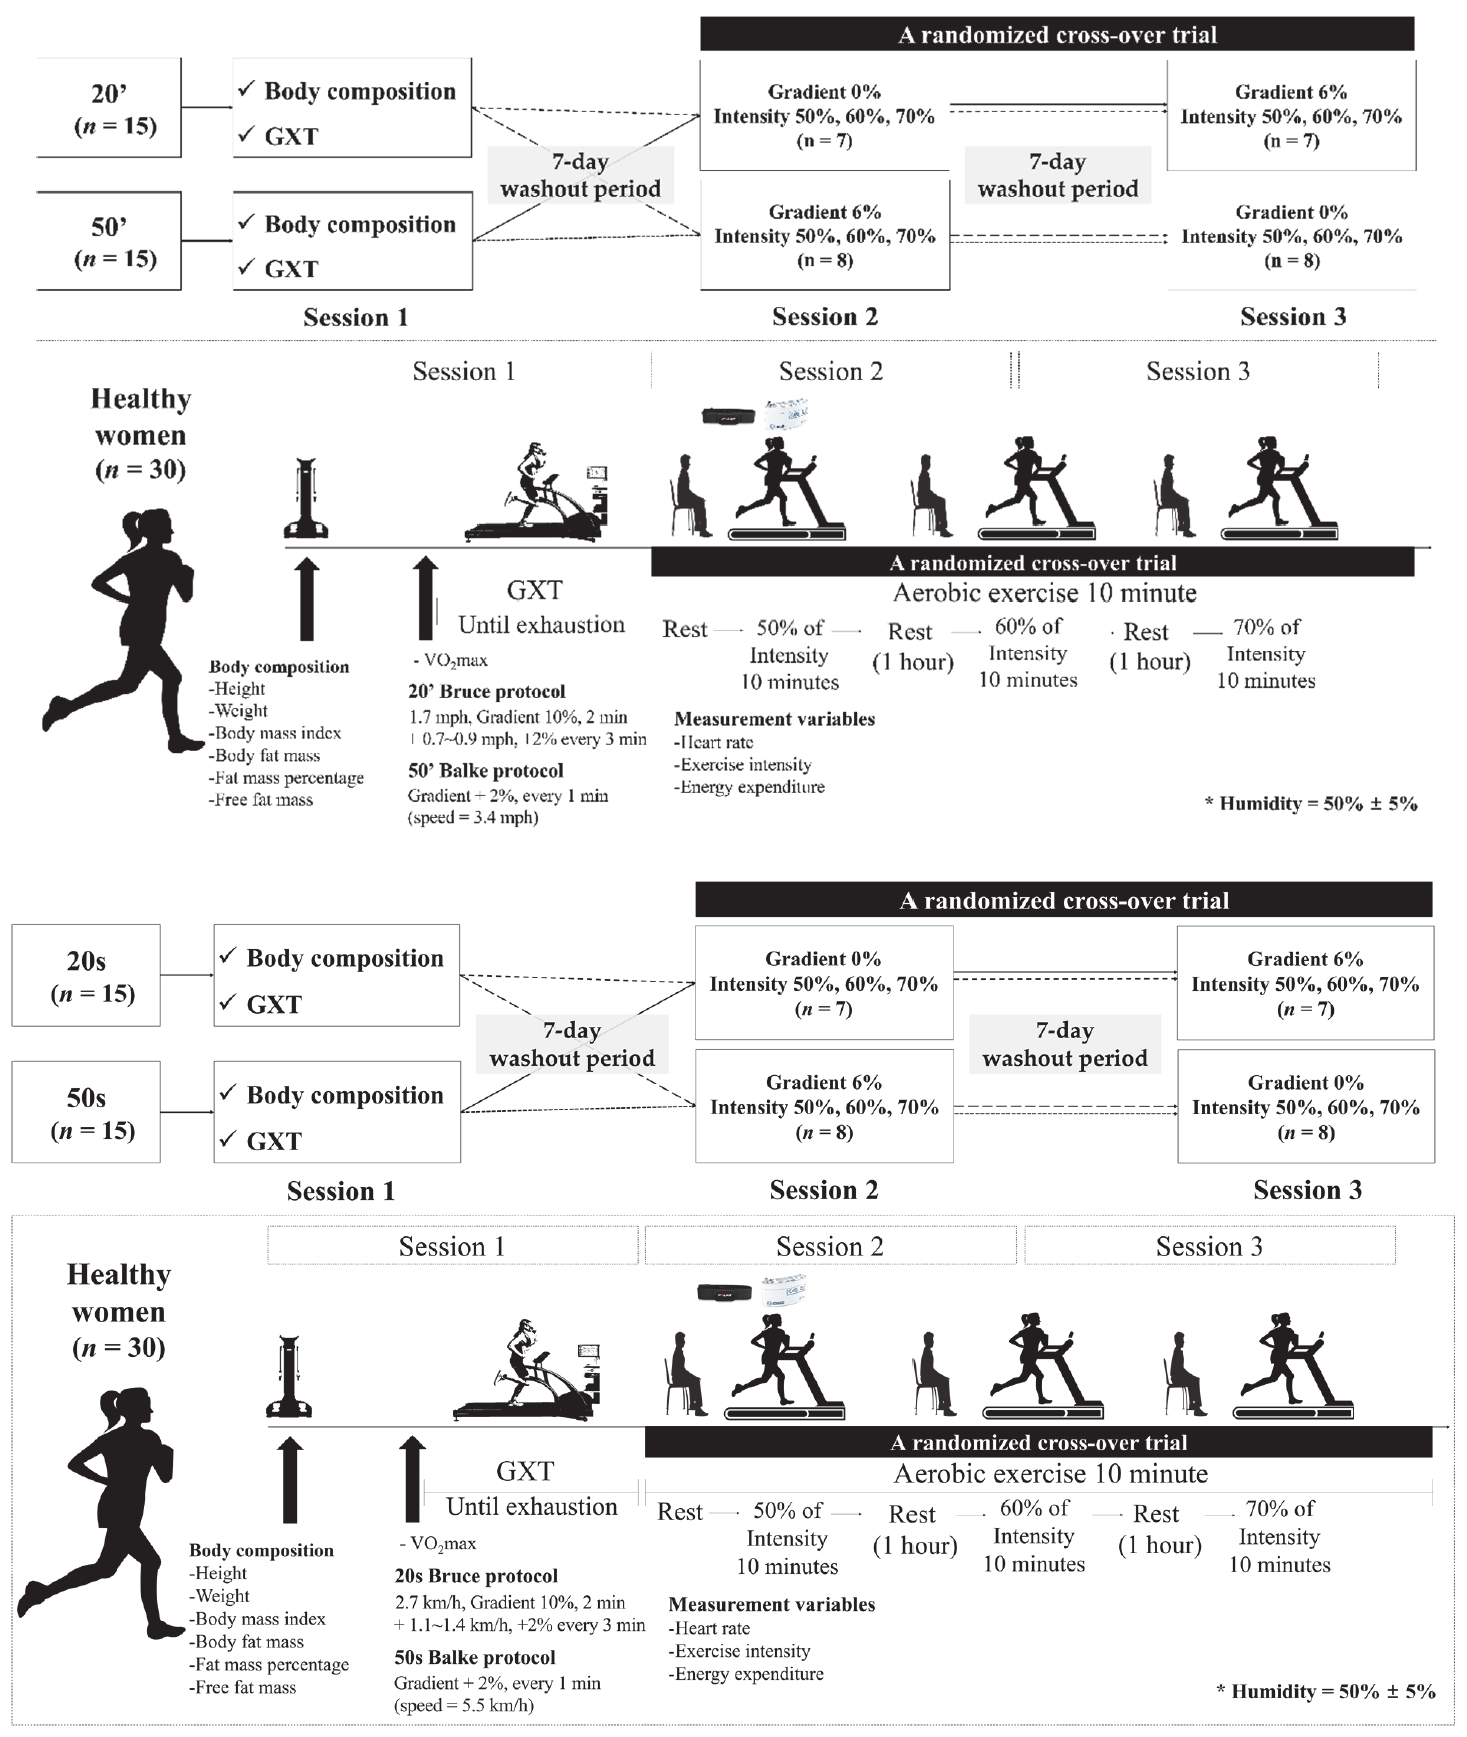
All participants visited the laboratory thrice during the experimental period. The study design is illustrated in Figure 1. ParticipantsŌĆÖ body composition was measured during the first visit. To minimize the adaptation effect, gradient (0% and 6%) and intensity conditions (50%, 60%, and 70%) were randomly selected, and each condition had a washout period of at least 1 week. During the experiment, all participants were allowed to rest for 30 min, after which the dependent parameters, including energy metabolism, were measured. All participants performed a graded exercise test (GXT) using a computerized cardiopulmonary metabolic system (Cosmed Treadmill T170 DE; Quark CPET, Cosmed Co., Rome, Italy). To perform aerobic exercise at a gradient of 0% and 6% by intensity, each individual exercise intensity was determined using a progressive exercise load test in advance. Individual exercise intensity settings were calculated as 50%, 60%, and 70% VO2max in terms of maximum oxygen uptake.
Participants were requested to arrive at the laboratory 1 h before the start of the experiment and warm-up for 5 min on a treadmill with an inclination of 0% and a speed of 2.5 km/h. After resting for 30 min, aerobic exercise was performed three times (50%, 60%, and 70% of VO2max) at different intensities for 10 min at each exercise intensity, with 1 h of rest between each. For data acquisition during exercise, cardiorespiratory function parameters and skeletal muscle oxygenation profiles were measured in increments of 10 seconds, and the average value for every 2 minutes in each section was calculated as the measured value. For each participantŌĆÖs contribution to energy use and energy consumption during treadmill aerobic exercise, the oxygen uptake (VO2/kg) per minute for each inclination was measured, and energy consumption was calculated using the average value of the 8-minute values of each exercise intensity. All laboratory conditions were maintained at a temperature of 23 ┬▒ 1┬░C and humidity of 50 ┬▒ 5%.
Body composition
All participants were asked to visit the laboratory at 8:30 am following an 8-hour fast and to wear light clothing and remove metal objects. Body composition, height, weight, free fat mass, body fat mass, and body fat percentage were measured using a multifrequency impedance device (Inbody 770, Biospace, Seoul, Korea). Body mass index (BMI) was calculated by dividing weight (kg) by the square of height (m2).
Maximal exercise test
To observe the change in aerobic exercise ability under equal environmental conditions, the maximum GXT was performed using a treadmill and respiratory gas analyzer (Cosmed Treadmill T170 DE, Quark CPET, Cosmed Co., Rome, Italy). For women in their 50s, the Balke protocol was applied, starting at a speed of 5.5 km/h and 0% incline in step 1, maintaining the speed every minute, but increasing the incline by 2%. The Bruce protocol was applied for women in their 20s. The first step was performed for 2 min at a walking speed of 2.7 km/h at 10% incline, and the subsequent steps increased the incline by 2% every 3 min and the speed by 1.1 to 1.4 km/h. During the test, the heart rate (HR) was measured using a heart rate monitor (HR monitor, Polar) at 1-minute intervals, and the rating of perceived exertion (RPE) was calculated using Borg [18]. To measure the physiology of the subject, the psychological state was continuously observed. Exercise was performed until the subject could no longer sustain the exercise, and after the exercise was stopped, a cool-down exercise was performed for 5 min. When at least three of the following conditions were satisfied, the subject was judged to have reached the stage of exhaustion and GXT was terminated: 1. when the HR did not increase in proportion to the exercise intensity; 2. when VO2 did not increase, even when exercise intensity increased; 3. when the respiratory exchange ratio (RER) was 1.10 or higher; 4. when the Borg scale score was 17 or higher; and 5. when the predicted HRmax exceeded 90%.
Main experiment
To perform aerobic exercise at a gradient of 0% and 6% by intensity, each individual exercise intensity was determined using a GXT in advance. Individual exercise intensity settings were calculated as 50%, 60%, and 70% VO2max in terms of maximum oxygen uptake. Participants were required to arrive at the laboratory 1 h before the start of the experiment and warm-up for 5 min at a treadmill inclination of 0% and a speed of 2.5 km/h after which they were allowed to rest for 30 min. Aerobic exercise was performed at different intensities (50%, 60%, and 70% of VO2max) for 10 min each, and the rest was performed for 1 h between exercise intensities. In addition, the experiment was conducted every seven days so that the results of the previous experiment did not affect future studies, but the experimental sequence of each gradient of aerobic exercise was selected by random assignment (Tables 2, 3, 4).
All participants had their oxygen uptake per minute (VO2) and carbon dioxide production per minute (VCO2) measured for each slope during treadmill aerobic exercise; carbohydrate oxidation, fat oxidation, and energy consumption (EE), which are substrate oxides, were calculated using the formula of Jeukendrup and Wallis [8]. However, protein oxidation was not evaluated in this study. To calculate protein oxidation, nitrogen excreted from sweat and urine is measured or radioisotopes are used, but previous studies reported that the contribution of protein oxidation as an energy source during exercise is very small [19]; therefore, it was excluded from this study.
Carbohydrate (CHO) oxidation (g) = 4.210 ├Ś VCO2ŌłÆ 2.962 ├Ś VO2
Fat oxidation (g) = 1.695 ├Ś VO2 ŌłÆ 1.701 ├Ś VCO2
Energy expenditure (EE, kcal) = 4.07 ├Ś CHO + 9.75├Ś FAT
Statistical analysis
Data obtained in this study were analyzed using the Statistical Package for the Social Sciences (SPSS) version 25.0 (IBM Corporation, Armonk, NY, USA), and the mean and standard deviation (SD) were calculated to present descriptive statistics. The normality and homoscedasticity of all outcome parameters were verified using the Shapiro-Wilk test. Repeated two-way ANOVA was performed to verify the average difference in the dependent variables between the three exercise intensities and between the two gradients. When the main effect of intensity, the main effect of gradient, or the interaction between intensity and gradient was significant, the difference between the exercise intensity within the gradient was analyzed using one-way ANOVA and the least significant difference (LSD) method. The difference between the gradients within exercise intensity was analyzed using a dependent t-test. In addition, the average difference in the dependent variable by age group in exercise intensity was analyzed using an independent t-test. The significance level (a) for all statistical analyses was set at p < 0.05.
RESULTS
Energy expenditure
Regarding the difference in energy expenditure by intensity according to the gradient within a specific age group, the main effect of intensity was found to be significant in both age groups (p < 0.05), and the interaction between intensity and gradient was not significant. On the other hand, the main effect of the gradient was found in the 20s group, but there was no significant difference between the gradients for all intensities. Regarding the difference in energy expenditure by intensity according to the gradient between the age groups, there was a significant difference between the two age groups at all gradients and intensities (p < 0.05), and the energy expenditure in the 20s age group was significantly higher than that in the 50s age group (Table 5, 6).
Fat oxidation
Table 7, 8 shows the differences in the fat oxidation rates. In both age groups, the main effect of intensity was not significant, the interaction between intensity and gradient was significant in participants in their 20s (p = 0.029), and the main effect of gradient was significant in participants in their 50s (p = 0.027). There was a significant difference in fat oxidation according to intensity between the two age groups, except for VO2max 70% intensity at a 6% gradient, and the fat oxidation in participants in their 20s was significantly higher than in participants in their 50s.
Carbohydrate oxidation
Table 9, 10 shows the differences in carbohydrate oxidation. In both age groups, the main effect of intensity on carbohydrate oxidation during aerobic exercise was significant (p < 0.001), and the interaction between intensity and gradient was not significant. On the other hand, the main effect of gradient was found only in participants in their 50s (p = 0.035). Post hoc analysis revealed that carbohydrate oxidation was significantly higher at 0% than at a gradient of 6% at VO2max 70% intensity. There was no significant difference in carbohydrate oxidation according to gradient intensity between the age groups.
DISCUSSION
This study compared and analyzed the effects of different gradients and ages on energy consumption and metabolic variables during aerobic exercise with equivalent exercise intensities (50%, 60%, and 70% of VO2max).
Exercise intensity is the most representative factor affecting energy metabolism during exercise, and it determines the ratio of carbohydrates and fats oxidized by muscles [20]. In this study, fat oxidation was compared using the substrate oxides calculation formula by Jeukendrup and Wallis [8] at 50%, 60%, and 70% of the equal VO2max according to gradient and age. The results of fat oxidation in this study showed no significant difference according to the increase in exercise intensity, but a significant difference was found between the VO2max 60% (29.49┬▒16.36) and 70% (22.92┬▒18.36) intensities at a 6% gradient for participants in their 20s.
Romijn et al. [21] reported that energy supply is achieved through fatty acid oxidation of plasma when exercise continues for > 30 min at 55%-75% of VO2max, which can be maintained for more than 90 min. Crisp et al. [22] showed similar results to this study for fat oxidation measured at exercise times of 3, 10, 20, and 30 minutes at intensities of VO2max 40%, 45%, 50%, 55%, and 60%, respectively. In addition, the absolute fat oxidation rate was reported to show no significant difference, and it was reported that fat oxidation was not affected in steady-state exercise within 30 min. As a result of this study, the reason for the lack of significant difference in fat oxidation due to the increase in exercise intensity is considered to be because the exercise time for each intensity was limited to 10 min.
As a result of fat acidification between gradients, there was a significant difference between 60% (0%: 11.25┬▒ 10.07, 6%: 17.89┬▒10.32) and 70% (0%: 8.10┬▒9.77, 6%: 17.02┬▒13.37) of VO2max for participants in their 50s. In both the 20s and 50s age groups, there was a higher tendency for fatty acid oxidation to increase during aerobic exercise with a gradient of 6% compared with that with a 0% gradient. Physiological and metabolic comparative studies on the effects of exercise type and exercise intensity [23] reported that there was no difference in fatty acid oxidation according to exercise type, but Zouhal et al. [24] reported that exercise using small muscle groups produced a low response to catecholamines depending on the type of exercise, and also affected the decrease in fat oxidation, suggesting that there was a difference in fat oxidation depending on the type of exercise. The results of a study analyzing muscle activation according to inclination during treadmill walking [25] suggest that activation of the quadriceps, gastrocnemius, and soleus muscles related to lower extremity muscles increased when walking on an inclined treadmill compared with walking on flat ground. The increase in fat oxidation in the 6% gradient aerobic exercise group in this study may be due to the availability of more muscle groups in this group compared with the 0% gradient aerobic exercise group.
Comparing the fat oxidation results between the two age groups showed that there was a significant increase in fat oxidation in women in their 20s compared to those in their 50s, and similar results were found in a study comparing fat oxidation according to womenŌĆÖs age [26]. It has been reported that the fat oxidation difference according to the increase in age is caused by the decreased metabolic function of the body using fat as an energy source owing to the accumulation of triglycerides in the muscles and low cardiorespiratory fitness [27]. This is thought to be the result of low oxygen uptake and high respiratory exchange rate reducing the ratio of fat oxidation in energy expenditure of women in their 50s compared with those in their 20s [8].
Energy expenditure has a linear relationship with heart rate and oxygen consumption [28]. McNarry et al. [29] reported that energy expenditure also increases proportionally when aerobic exercise increases, and as reported in previous studies, an increase in speed during aerobic exercise can increase energy expenditure [30]. In this study, energy expenditure significantly increased as exercise intensity increased, which is considered to be the result of an increase in exercise speed as exercise intensity increased. In addition, the increase in exercise intensity according to age showed a lower energy expenditure in the 50s age group than in the 20s age group; this finding is supported by Bavenholm et al. [31], who reported that energy expenditure decreases with age.
This study has several limitations. First, it was necessary to calculate protein oxidation by measuring the nitrogen excretion portion in the urine, but this was not calculated due to the findings of previous studies. Second, an exercise time of 30 min or more is required for fat metabolism, but in this study, exercise time was limited to 10 min. Third, the psychological state of the participants in this study could not be controlled equally. Despite these limitations, the results of this study were meaningful.
In conclusion, it was found that, regardless of age, energy expenditure and fat oxidation were higher in walking with a gradient of 6% than in walking with a gradient of 0%. In particular, to have a positive effect on resolving obesity in women in their 50s, it can be concluded that walking on a gradient of 6% rather than walking on a gradient of 0% at an equal intensity would be more effective in increasing fat oxidation. When performing aerobic exercises, such as flat walking and gradient walking, if the same energy consumption appears, increasing the gradient will decrease the speed, thereby lowering the risk of knee injury and increasing the rate of fat metabolism. In addition, there is an advantage in that both energy expenditure and fat oxidation can be increased when exercise is performed at 60% of VO2max among various exercise intensities. Therefore, since gradient walking is judged to be an effective method of relieving obesity, it can be actively applied in the field. However, to examine the difference in fat oxidation among exercise intensities more accurately, an exercise time > 30 min is required. Follow-up studies are required in the future to investigate the effect of various gradients on physiological and metabolic characteristics when carrying out aerobic exercises for more than 30 min.