The effect of oral glucose tolerance testing on changes in arterial stiffness and blood pressure in elderly women with hypertension and relationships between the stage of diabetes and physical fitness levels
Article information
Abstract
[Purpose]
The purpose of this study was to assess changes in blood glucose level, blood pressure, and arterial stiffness after a 75 g oral glucose tolerance test (OGTT) in elderly women aged over 65 years with hypertension and either normal glycemic control, impaired fasting glucose tolerance, or diabetes mellitus. We also wished to investigate the relationship between stages of diabetes and physical fitness.
[Methods]
A total of 24 elderly women with hypertension were assigned to a control group (CON; n=7), impaired fasting glucose group (IFG; n=9), and diabetes mellitus group (DM; n=8). In each group, blood glucose level, brachial ankle pulse wave velocity (PWV), and blood pressure were measured at baseline as well as 60 and 120 minutes after a 75 g OGTT. Physical fitness factors such as hand grip strength, balance test, 4 m gait speed test, chair stand test, short physical performance battery, and 6-minute walking test were subsequently assessed.
[Results]
In all three groups, blood glucose levels were significantly increased at 60 and 120 minutes after a 75 g OGTT. In the DM group, blood glucose levels were significantly higher before and after a 75 g OGTT than in the CON group. In the CON group, PWV was significantly increased at 60 minutes after a 75 g OGTT; however, there were no changes in other groups after glucose ingestion. In the CON group, systolic and diastolic blood pressures were significantly decreased at 60 and 120 minutes after a 75 g OGTT compared to baseline. However, there was no change in blood pressure after ingestion in the DM group. The IFG group had greater grip strength than the CON group; however, there were no differences in other variables between the groups.
[Conclusion]
After a 75 g OGTT, elderly women with hypertension and diabetes maintain higher blood glucose levels compared to those with hypertension alone. Unlike elderly women with hypertension alone, those with hypertension and diabetes did not show changes in arterial stiffness and blood pressure after a 75 g OGTT. Therefore, elderly women with hypertension and diabetes may not be able to control their blood vessels following a 75 g OGTT due to impaired vascular endothelial function. Moreover, there was no association between diabetes stage and physical fitness in elderly women with hypertension.
INTRODUCTION
The elderly, defined by the World Health Organization as someone above the age of 65 years (WHO. 2010), are the population group with the fastest rate of growth across the world [1]. In 2018, 14.3% of the population of Korea was aged over 65 years, and this proportion is expected to increase to 20.8% in 2026, leading to a super-aged society [2]. According to a report by the National Health Insurance Service, medical expenses for the elderly increased by 2.1-fold between 2011 and 2018 [3], and this increase is attributed to the rising incidence of cardiovascular and chronic diseases due to the functional decline of insulin and weakening of muscles in the elderly [4,5]. In particular, the 2018 National Health Statistics data from the Korea Centers for Disease Control and Prevention identified hypertension in 34.7%, 46.0%, and 70.2% of individuals aged between 50–59 years, 60–69 years, and over 70 years, respectively. This translates into 7 out of 10 of the population aged over 65 years being diagnosed with hypertension, and suggests that the prevalence of hypertension rises with increasing age [6,7].
Hypertension decreases vasodilation by vascular endothelial cells, thereby increasing arterial stiffness [1,8,9]. Arterial stiffness refers to a reduced ability to vasodilate and vasoconstrict in response to changes in arterial pressure [10]; severe arterial stiffness can lead to arteriosclerosis, which can result in cardiac dysfunction [11]. In addition, arterial stiffness can cause increased systolic blood pressure and induce left ventricular hypertrophy. Diastolic blood pressure can also be decreased, leading to coronary artery damage [12]. Pulse wave velocity (PWV), which is a measure used to assess arterial stiffness, systolic pressure, and diastolic pressure, increases with aging [13]. Previous studies performed on the elderly have shown that increased PWV is closely related to arteriosclerosis, cardiovascular disease, and mortality [14-16]. In addition, arterial stiffness is more frequently observed in the elderly than in younger individuals [17-19]. As such, arterial stiffness is closely related to age and cardiovascular disease [16].
Impaired glucose tolerance is a factor that affects arterial stiffness [20]. Previous studies have demonstrated that type 2 diabetes induces acute and chronic microvascular complications as well as cardiovascular complications [21,22], and it is involved in the development of arterial stiffness [10]. The exact mechanism through which the occurrence of cardiovascular diseases can be reduced by regulating blood glucose levels has not been identified. However, high blood glucose levels elevate systolic blood pressure and induce left ventricular hypertrophy, which interferes with blood supply to the coronary arteries during the diastolic phase. Thus, this can increase arterial stiffness [23, 24]. Studies on healthy adults have shown that arterial stiffness is higher in those who have a higher fasting blood glucose level [25] and that higher glucose intake leads to increased arterial stiffness [26]. Additionally, a study on elderly patients aged around 70 years showed that arterial stiffness was higher in elderly individuals with decreased glucose tolerance [27-30], and performing the oral glucose tolerance test showed that arterial stiffness was higher in elderly individuals with diabetes than in healthy elderly individuals [31]. Therefore, glucose tolerance function is related to blood pressure and arterial stiffness, and findings from the above studies suggest that controlling blood glucose levels can prevent cardiovascular diseases [32,33].
Decreased gait ability and weakening of lower extremity muscle strength due to aging in the elderly are highly correlated with decreased glucose tolerance, hypertension, and increased arterial stiffness [34]. The American Heart Association and the American Sports Medicine Guidelines recommend 30 minutes of moderate intensity physical activities for 5 days a week to maintain health in the elderly and 45 minutes of exercise and physical activities for 3 times a week to lower blood pressure [35]. In previous studies, the elderly who did not perform moderate or higher intensity physical activities had a higher risk of impaired glucose tolerance and diabetes compared to those who performed such activities [36,37]. Moreover, elderly individuals who walk more than 10,000 steps daily have been shown to have less arterial stiffness compared to those who walked less than 6,000 steps daily [38-40], and the risk of arterial stiffness was decreased in the elderly group without impaired glucose tolerance whose physical activities increased for one month [41]. It has been shown in previous studies that exercise and physical activities affect arterial stiffness and glucose tolerance in the elderly. Studies on physical strength factors have demonstrated that the incidence of diabetes is highly related to reduced skeletal muscle mass [42] and that elderly individuals with diabetes have weak grip strength [43,44]. In addition, there is an association between elderly individuals with hypertension and slow gait speed [45, 46]. In Korea, elderly individuals with hypertension and diabetes have been shown to have weak grip strength [9,47]. As such, physical function is thought to be an important factor in predicting and treating various health conditions in the elderly, and decreased physical function in the elderly is associated with a deterioration in health [48,49].
Most previous studies in the elderly assessed the relationships between hypertension and glucose tolerance function, between hypertension and arterial stiffness, and between glucose tolerance function and arterial stiffness [50-53]. However, there are no studies that have specifically evaluated the changes in arterial stiffness, blood pressure, and glucose tolerance during oral glucose tolerance testing among elderly women with hypertension. We therefore proposed the following hypothesis. In elderly women with hypertension who have reduced fasting glucose tolerance function: (i) will experience greater changes in blood glucose, (ii) will have more arterial stiffness and higher blood pressure over time after OGTT, and (iii) will have lower physical strength levels. Therefore, the purpose of this study was to assess changes in blood glucose levels, blood pressure, and arterial stiffness after a 75 g oral glucose tolerance test (OGTT) in elderly women with hypertension over the age of 65 years with impaired fasting glucose tolerance and diabetes mellitus; furthermore, we aimed to investigate the relationship between stages of diabetes and physical fitness.
METHODS
Participants
A total of 27 elderly women over the age of 65 years with hypertension (stable systolic blood pressure above 140 mmHg or diastolic blood pressure above 90 mmHg) who lived in S city of G province (urban area) were recruited. The target number of subjects was calculated using Gpower software (Gpower.software.informer.com/3.1). A total of 24 subjects were calculated using an effect size of 0.3, a=0.05, and 1-b (power) = 0.8. The power was approximately 85% [54], and considering possible withdrawals due to nausea and abdominal pain during the oral glucose tolerance test, 27 subjects were recruited. Those who did not perform regular physical activities and aerobic as well as anaerobic exercises at least twice a week within the last 6 months were selected. We excluded from the study those with a history of surgery for severe arthritis, artificial joint insertion, a limited walking ability, a history of cardiovascular surgery, incurable cancer, dementia or an inability to communicate, uncontrollable convulsions, type 1 diabetes, or chronic enteritis. A detailed explanation about the background, purpose, and procedures of this study was provided to every subject prior to participation, and written consent was obtained from those who voluntarily agreed to participate. This study was conducted after obtaining approval from the Institutional Review Board (IRB) of the institution (Approval Number KUIRB-2019-0161-01).
Study design
The experimental procedures of this study are shown in Figure 1. The subjects were asked to visit the laboratory in the S center located in K province 3 times, and at the first visit the subjects were selected and written consent was obtained. Blood analysis was performed on the subjects at the first visit, and based on the fasting glucose tolerance function results, the subjects were assigned to the control group (CON; fasting glucose level < 100 mg/dL, n=7), impaired fasting glucose group (IFG; fasting glucose level 100–125 mg/dL, n=9), and diabetes mellitus group (DM; fasting glucose level >126 mg/dL, n=8) [55]. At the second visit, the subjects did not consume any food other than water after 10 pm on the day before their visits in addition to any medications; blood was collected during this second visit, and height and body composition were measured. At the third visit, fasting blood glucose level and resting PWV and blood pressure were measured. Subsequently, a 75 g OGTT was performed, and blood glucose level, PWV, and blood pressure were measured at 60 and 120 minutes. Physical strength factors such as hand grip strength, short physical performance battery (SPPB), and the 6-min walk test were measured after 10-min of resting PWV measurements.

Experimental design.
Measurements
Physique and body composition
Height (cm) was measured using a manual extensometer (Seca, Hamburg, Germany). The subjects were asked to stand upright as much as possible with bare feet in light clothing, their eyes forward, and their chin slightly lowered to level the eyes and ears. Weight (kg) was measured using an electronic balance (CAS Corporation, Seoul, Korea). Body composition was assessed using a bioelectrical resistance tester (Inbody 279, Biospace Korea, Seoul, Korea). After entering personal information (name, age, height, and sex) and removing any conductive objects such as rings, necklaces, bracelets, and coins from the body, the subjects were asked to take off their shoes and socks while wearing comfortable clothing and stand on the device. Hands and feet were placed on the sensor without any movements during measurement to measure body fat mass (kg), body fat percentage (%), and lean mass (kg).
Blood test
To analyze blood components, subjects fasted for approximately 8 hours or more after 20:00 the day before measurement. After arriving at the laboratory on the next morning, the subjects rested for 10 minutes and 10 mL of blood was collected from the antecubital vein by a professional health care provider. Of this 10 mL, 4 mL was aliquoted into an anticoagulant-containing ethylenediaminetetraacetic acid (EDTA) tube and centrifuged at 3,000 rpm for 10 minutes to collect the plasma. Of the remaining blood, 5 mL was put into a serum separation tube (SST) and centrifuged at 3,000 rpm for 20 minutes to collect the serum.
All samples were quickly frozen and stored at –80°C, and collected venous blood samples were analyzed by the Green Cross Medical Foundation (Certified organization in The Korea Society for Laboratory Medicine). Glucose and HbA1c were analyzed using UV spectrophotometry (UVS) and turbidimetric immunoassay (TIA), respectively. Total cholesterol was analyzed with colorimetry and the enzymatic colorimetric assay method was used with the Triglyceride (TG) kit (Roche, Mannheim, Germany), High Density Lipoprotein Cholesterol (HDL-C) plus 3rd generation kit (Roche, Mannheim, Germany), and Low Density Lipoprotein Cholesterol (LDL-C) plus 2nd generation kit (Roche, Mannheim, Germany). The electrochemiluminescent immunoassay (ECLIA) technology assay method was used with the Insulin kit (Roche, Mannheim, Germany). Homeostatic model assessment - insulin resistance (HOMA-IR), which indicates insulin resistance, was calculated using the following formula (HOMA-IR = fasting insulin level [μU/ml] × fasting blood glucose level [mg/dl]/405) [56].
Oral glucose tolerance test
The subjects fasted for approximately 8 hours or more after 22:00 the day before measurement. After arriving at the laboratory the next morning, blood pressure and arterial stiffness were measured in the subjects, and the subjects had a rest for 10 minutes. Afterwards, finger blood glucose test (ACCU-CHEK, Roche Diabetes Care, Inc., Indianapolis, IN, USA) was performed to measure the resting glucose level, and the subjects consumed Gluorange 100 solution (225 mL, McNulty Korea, Cheonan, Korea. Glucose 75 g) prior to measurement of their blood glucose level after 60 and 120 minutes.
Arterial stiffness
The subjects were asked to rest for 5 minutes with their arms and legs straight in an upright lying position in order to measure arterial stiffness (PWV, VP-1000, Omron, Tokyo, Japan). A heart sound map was placed in the second intercostal space of the left sternum to confirm a stable state, and pulse wave was measured. Arterial stiffness was measured by assessing the PWV using cuffs with built-in sensors on both the upper arms and ankles. The time interval to determine brachial-ankle PWV (ba-PWV) was automatically calculated from the starting point of the increase in the pulse wave using a built-in formula based on the distance between the kidneys and arteries in the arms and ankles (Brachial-Ankle PWV: baPWV=ΔL/Δt = L2-L1/Δt) [57].
Blood pressure
Subjects were asked to rest for 10 minutes after arriving, and systolic blood pressure (SBP), diastolic blood pressure (DBP), and heart rate at rest (HRrest) were measured using JPN1 (Omron, Tokyo, Japan), which is an automatic sphygmomanometer with sensors placed between the right upper arm bones. SBP, DBP, and HRrest were measured twice in the resting state to calculate a mean value, and the time interval between the two measurements was 2 minutes. Mean arterial stiffness = DBP + (SBP – DBP) [58] and Pulse pressure = SBP – DBP [59] were used for calculation.
Functional strength
1) Muscular strength: hand grip strength (Takei Hand Grip Dynamometer, kg) was measured by calculating the average value of two measurements. The grip dynamometer was properly adjusted to the second joints of the fingers of the main hand. While maintaining the body and arms at 15°, the subjects were asked to pull the dynamometer with the arms straight for measurement [60].
2) SPPB: The balance test, chair stand test, and 4 m gait speed test were performed, and the measurements were scored to calculate a total score out of 12 points. The balance test was performed in three different positions. A point was given when the feet were not separated and did not move for more than 10 seconds, with both feet together side-by-side and one foot’s heel touching the other foot’s big toe. If the subject could not perform these movements, the 4 m gait speed test was performed to measure the gait speed; in this test, a 10 m-long line was drawn and the subject was asked to walk 10 m at a fast pace. The time to walk 4 m was then measured. In the chair stand test, the subjects were asked to sit on the chair initially, and after a signal the time to stand and sit on a chair repeatedly 5 times was measured. The arms were resting at the side of the body and the standing movement was performed with only the legs [61].
3) Cardiovascular endurance: In the 6-min walking test (m), a 20 m × 20 cm space was created, and the subjects were asked to walk as quickly as possible for 6 minutes starting from the start signal. At the end, the total distance travelled (m) was measured. When walking, all parts of the feet had to touch the ground, and the subjects were not allowed to run. The total distance travelled from the start point was measured in m after 6 minutes [62].
Statistical analysis
SPSS (Ver. 22.0, IBM Corp., Armonk, NY, USA) was used for analysis in this study, and descriptive statistics were performed for each measured item in order to calculate the mean and standard deviation (SD). The Kolmogorov-Smirnov test was performed to test the normality of the data. The variables of height, muscle mass, fat mass, waist-hip ratio, leg circumference, triglycerides, SBP 60 min, balance tests, gait speed test, and chair stand test, whose data did not follow a normal distribution, were analyzed using a nonparametric method (Wilcoxon›s signed-rank test). One-way analysis of variance (ANOVA) was performed to verify the differences in the means of the dependent variables between the three groups in this study, and Tukey›s method was used for post-hoc analysis. Two-way repeated measures ANOVA was performed to assess the differences between treatment and timing. The significance level of all statistical analyses was set to .05.
RESULTS
Table 1 shows the body composition and characteristics of the elderly women with hypertension by groups, based on their fasting blood glucose levels. There were no significant differences in age, height, weight, body mass index, body fat mass, body fat percentage, waist circumference, hip circumference, waist-hip ratio (WHR), arm circumference, or leg circumference between the three groups. There was a significant difference in skeletal muscle mass between the groups (p=.022), which was significantly higher in the IFG group than in the CON group (p=.022).

Basic characteristics by group.
Table 2 shows fasting blood levels of elderly women with hypertension by groups based on fasting blood glucose levels. Glucose levels were significantly different between the groups (p=.001), being higher in the DM group than in the CON and IFG groups (both ps=.001). HbA1c was significantly different between the groups (p=.003), being significantly higher in the DM group than in the CON and IFG groups (p=.003 and p=.03, respectively). There were no significant differences in total cholesterol (TC), HDL-C, LDL-C, and TG levels between the groups. Insulin concentration was significantly different between the groups (p=.025), being significantly higher in the DM group than in the CON group (p=.022). HOMA-IR was also significantly different between the groups (p=.005), being significantly higher in the DM group compared to the CON group (p=.004).

Fasting blood variables by group.
Evaluation of blood glucose levels between groups after a 75 g OGTT (Figure 2-A) showed that blood glucose levels were higher in the DM group than in the CON group at 60 minutes after ingestion (p=.002). At 120 minutes after ingestion, the blood glucose level in the DM group was higher than that in the CON group (p=.004). In all three groups, blood glucose was significantly increased at 60 and 120 minutes. In the two-way repeated ANOVA the 75 g OGTT was significant in time and group as well as the interaction effect (Time, p=.000; Group, p=.002; Interaction, p=.026). Area under the curve (AUC) was analyzed for changes in blood glucose after a 75 g OGTT, and the changes in blood glucose in the DM group were significantly higher than that in the CON group (p=.001).
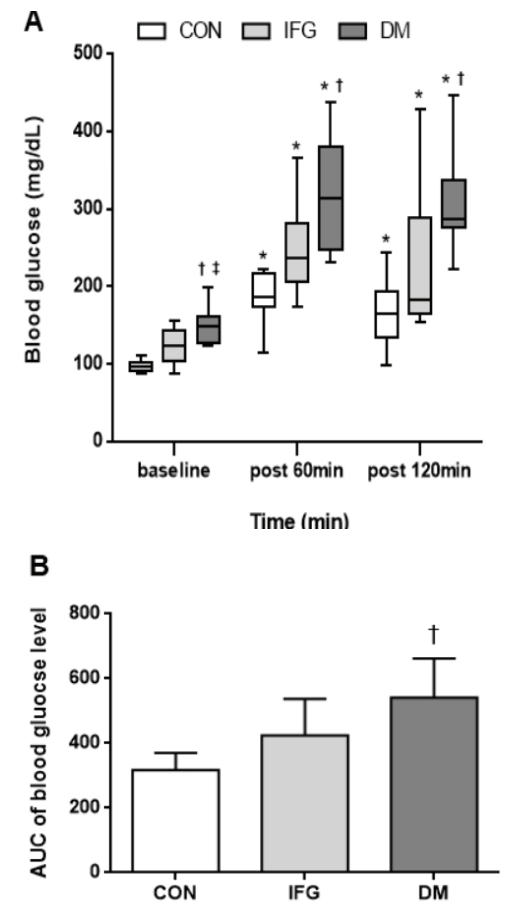
(A) Changes in blood glucose baseline at 60 min and 120 min after the 75 g OGTT (oral glucose tolerance test) by group. (B) AUC (area under the curve) of the change of blood glucose level after the 75 g OGTT by group. CON: Control, IFG: Impaired fasting glucose, DM: Diabetes mellitus. Values represent mean ± standard deviation (SD), * p <.05 vs baseline, † p <.05 vs CON, ‡ p <.05 vs IFG. The 2 way ANOVA result was Time(f = 77.713; p = .000), Group(f = 8.993; p = .002), and Interaction(f = 3.066; p = .03).
Arterial stiffness after a 75 g OGTT was compared between the groups (Figure 3), which demonstrated no significant differences between the groups at 60 and 120 minutes after a 75 g OGTT. In the CON group, arterial stiffness significantly increased at 60 minutes from the baseline after a 75 g OGTT, and there was no significant difference at 120 minutes (p=.038; p=.704). The IFG and DM groups showed no significant intra-group differences at 60 and 120 minutes. In addition, a two-way ANOVA showed no significant results (Time, p=.199; Group, p=.215; Interaction, p=.342).
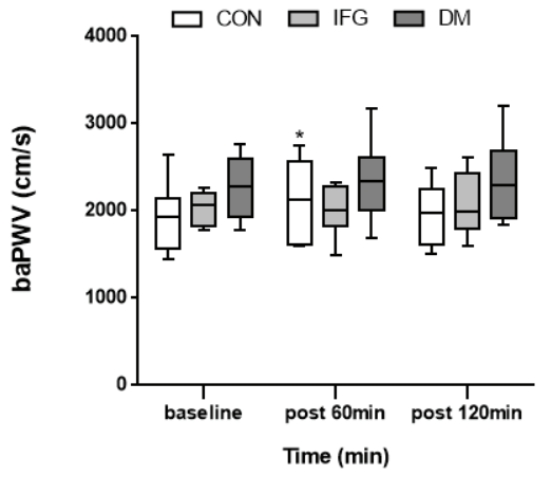
Changes in baPWV baseline at 60 min and 120 min after the 75 g OGTT by group. CON: Control, IFG: Impaired fasting glucose, DM: Diabetes mellitus, baPWV: brachial-ankle pulse wave velocity. Values represent mean ± standard deviation (SD). * p <.05 vs baseline. The 2 way ANOVA result was Time(f = 1.681; p = .199), Group(f = 1.653; p = .215), and Interaction(f = 1.160; p = .342).
Blood pressure after a 75 g OGTT was compared between the groups (Table 3). At 60 minutes after ingestion, SBP and PP were significantly higher in the IFG and DM groups than in the CON group (p=.026; p=.031), and there were no significant differences between 60 minutes and 120 minutes (p=.920). In CON group, SBP was significantly lower at 60 and 120 minutes compared to baseline (p=.012; p=.004); however, there was no significant difference between 60 and 120 minutes (p=.736). In the IFG group, blood pressure was significantly lower at 120 minutes compared to baseline (p=001). In the DM group, there were no significant differences at 60 and 120 minutes compared to baseline (p=.941; p=.403). There were no significant changes in DBP after a 75 g OGTT between the three groups at baseline, 60 minutes, and 120 minutes (p=.854; p=.927; p=.419). In the CON group, DBP was significantly lower at 60 and 120 minutes compared to baseline (p=.035; p=.003). In the IFG group, DBP was significantly lower at 120 minutes (p=.001). However, DBP was not significantly changed in the DBP group at 60 and 120 minutes (p=.437; p=.330).

Changes in blood pressure (SBP, DBP, MAP, PP, HRrest) at 60 min and 120 min after 75 g glucose ingestion by group.
Table 4 shows physical fitness factors of elderly women with hypertension by groups based on fasting blood glucose level. There were no significant differences in balance test score, 4 m gait speed test score, chair stand test score, SPPB, and 6-minute walking between the three groups (p=.176; p=.505; p=.843; p=.236; and p=.171, respectively); however, grip strength in the IFG group was significantly higher than that of the CON group (p=.007).

Physical fitness level by group.
DISCUSSION
In this study, elderly women with hypertension were assigned to control (CON), impaired fasting glucose (IFG), and diabetes mellitus (DM) groups based on the fasting blood glucose level, and changes in blood glucose level, arterial stiffness, and blood pressure were assessed after ingestion of 75 g glucose. In addition, the relationship of these variables to physical fitness was analyzed for each group. Our main findings were as follows: blood glucose was significantly increased in all groups during a 75 g OGTT. In the DM group, blood glucose levels before and after the glucose intake were higher than in the CON group. Arterial stiffness was only significantly increased at 60 minutes compared to baseline in the CON group. There were no significant changes in other groups. Moreover, there were no differences in arterial stiffness between the three groups after glucose ingestion. Blood pressure was significantly lowered after glucose ingestion in the CON group; however, there were no significant changes in blood pressure in other groups after glucose ingestion. In addition, hand grip strength was significantly higher in the IFG group than in the CON group; however, there were no significant differences in other items between the groups.
In our study, groups with lower glucose tolerance function showed higher blood glucose levels after a 75 g OGTT. It is thought that decreased capacity to reduce blood glucose levels, which is increased after glucose intake, resulted due to high insulin resistance in those groups with decreased glucose tolerance function. In fact, our study demonstrated that insulin concentration and HOMA-IR were higher with decreased glucose tolerance function, which is consistent with the findings of previous studies [63-66].
In our study, changes in arterial stiffness were assessed at 60 and 120 minutes after a 75 g OGTT in elderly women with hypertension. In the CON group, arterial stiffness was significantly increased at 60 minutes after a 75 g OGTT, and this result is consistent with that of previous studies on adults without diabetes [33,67]. In particular, blood glucose and arterial stiffness were increased at 60 minutes after glucose ingestion and decreased at 120 minutes in the CON group. This finding is consistent with that of previous studies on healthy elderly subjects, which demonstrated that blood glucose and arterial stiffness were greatly increased between 30 and 60 minutes and decreased after 120 minutes after a 75 g OGTT [40,68]. In contrast, such findings were not observed in the IFG and DM groups. Furthermore, the DM group had higher arterial stiffness before and after glucose intake compared to the CON group; however, there was no significant difference. This finding is contradictory to that of previous studies by Choi et al. [69] and Foreman et al. [70], in which groups of patients with diabetes mellitus showed higher arterial stiffness than those in the impaired fasting glucose and control groups. It is thought that arterial stiffness and vascular endothelial function caused by aging and complications of diabetes and hypertension were more impaired in the subjects of our study compared to those of previous studies [71]. Additionally, diabetes decreases the bioavailability of nitric oxide, thereby reducing the contraction and relaxation functions of blood vessels; diabetes also increases oxidative stress, which reduces the elasticity of blood vessels and causes disorders in vascular endothelial functions [72-74]. Thus, it is thought that a 75 g OGTT was insufficient to detect dynamic changes in arterial stiffness of the DM group, who are expected to have blood vessel damage.
In the DM group, SBP was higher than in the other groups when a 75 g OGTT was performed on elderly women with hypertension. This pattern was similar to that of arterial stiffness as shown in Figure 3. Furthermore, the IFG and DM groups had higher blood pressure at 60 minutes after glucose intake than the CON group. The higher blood pressure in the IFG and DM groups who have low insulin sensitivity may be caused by vascular endothelial resistance to insulin action [75]. In contrast, SBP and DBP were significantly lowered at 60 minutes after a 75 g OGTT in the CON group. These findings were similar to that of the study by Vloet et al. [76], which assessed postprandial blood pressure in hypertensive elderly subjects without diabetes. It is thought that the concentration of blood flow to expand blood vessels in organs for digestion of food would have resulted in decreased blood pressure [77].
In this study, the balance test, 4 m gait speed test, chair stand test, SPPB, and 6-minute walking test results were not significantly different between the groups. Contrary to our expectations, grip strength was significantly higher in the IFG group than in the CON group. Previous studies have reported that grip strength is weaker with decreased glucose tolerance function and that grip strength is related to diabetes [78-80]. In Table 1 of our study, skeletal muscle mass was higher in the IFG group than in the CON group, which may have caused a greater grip strength in the IFG group. As the spectrum of aging and physical fitness is wide, there are difficulties in acquiring cross-sectional study data on the effects of physical fitness. Although such data was not shown in this study, 6 and 1 subjects in the CON group had frailty and pre-frailty, respectively. In IFG group, all 9 subjects had pre-frailty, which may explain the higher skeletal muscle mass of the IFG group relative to the CON group. Among the 5 criteria used to judge frailty (weight loss, fatigue, muscle weakness, walking speed, and physical activity), satisfaction of 3 or more and 1 or 2 criteria are defined as frail and pre-frail, respectively [81]. Given that previous studies have shown that frailty is related to grip strength and muscle weakness [81-83], future studies should consider various factors such as body composition and physical frailty.
There were several limitations to this study. First, this study was only conducted on female elderly subjects over the age of 62 living in one city of an urban area, which may limit the generalizability of the study findings. Second, a group of subjects with normal blood pressure could not be recruited. Third, nutritional intake of the subjects could not be assessed.
In conclusion, elderly women with hypertension and diabetes had a higher blood glucose level than those with hypertension alone during a 75 g OGTT. In elderly women with hypertension alone, changes in arterial stiffness and blood pressure were observed after a 75 g OGTT. On the other hand, elderly women with hypertension and diabetes did not show changes in arterial stiffness and blood pressure after a 75 g OGTT. Therefore, elderly individuals with hypertension and diabetes appear to have impaired vascular endothelial function due to persistent hyperglycemia, leading to poor vascular regulatory response to a 75 g OGTT. Moreover, there was no association between diabetes stage and physical fitness in elderly women with hypertension; it is believed that other factors such as frailty and effects of medication and nutrition intake have larger effects, and future studies in a larger, more representative population are required.
Acknowledgements
This research was supported by the College of Education, Korea University Grant in 2020.