Estimating excess post-exercise oxygen consumption using multiple linear regression in healthy Korean adults: a pilot study
Article information
Abstract
[Purpose]
This pilot study aimed to develop a regression model to estimate the excess post-exercise oxygen consumption (EPOC) of Korean adults using various easy-to-measure dependent variables.
[Methods]
The EPOC and dependent variables for its estimation (e.g., sex, age, height, weight, body mass index, fat-free mass [FFM], fat mass, % body fat, and heart rate_sum [HR_sum]) were measured in 75 healthy adults ( 31 males, 44 females). Statistical analysis was performed to develop an EPOC estimation regression model using the stepwise regression method.
[Results]
We confirmed that FFM and HR_sum were important variables in the EPOC regression models of various exercise types. The explanatory power and standard errors of estimates (SEE) for EPOC of each exercise type were as follows: the continuous exercise (CEx) regression model was 86.3% (R2) and 85.9% (adjusted R2), and the mean SEE was 11.73 kcal, interval exercise (IEx) regression model was 83.1% (R2) and 82.6% (adjusted R2), while the mean SEE was 13.68 kcal, and the accumulation of short-duration exercise (AEx) regression models was 91.3% (R2) and 91.0% (adjusted R2), while the mean SEE was 27.71 kcal. There was no significant difference between the measured EPOC using a metabolic gas analyzer and the predicted EPOC for each exercise type.
[Conclusion]
This pilot study developed a regression model to estimate EPOC in healthy Korean adults. The regression model was as follows: CEx = -37.128 + 1.003 × (FFM) + 0.016 × (HR_sum), IEx = -49.265 + 1.442 × (FFM) + 0.013 × (HR_sum), and AEx = -100.942 + 2.209 × (FFM) + 0.020 × (HR_sum).
INTRODUCTION
Regular physical activity (PA) and exercise are the most important factors for maintaining or improving health, regardless of age or sex [1]. Lack of PA and exercise negatively affects health by causing over-energy accumulation and increased abdominal obesity and insulin resistance in the body, leading to increased mortality from cardiovascular and metabolic diseases [2]. Recently, PA and exercise have been encouraged to improve such problems, as PA is restricted and sedentary behavior is increased due to the implementation of social distancing due to the coronavirus disease 2019 (COVID-19) outbreak [3].
Physical activity occurs as energy expenditure increases due to physical movement caused by skeletal muscle contraction, and the PA category includes activities necessary for daily life (standing, walking slowly, lifting objects, etc.) and exercise of various intensities. The guidelines on PA recommend at least 150 min of moderate-intensity aerobic activity per week and 75 min of vigorous-intensity aerobic activity per week [4]. The American College of Sports Medicine (ACSM) recommends aerobic exercise at least three times a week to promote health, more than 50 min with 40–70% of maximum oxygen consumption (VO2max), and 20 min with 70–90% of VO2max [5]. Despite these guidelines, most adults do not meet the amount of PA to improve their health, and in Korea, one in four adults was found to lack PA [6]. Therefore, efforts to increase the energy consumption of PA or exercise should be emphasized.
To increase energy consumption, the type, frequency, intensity, and time on various forms of PA and exercise are considered, and the higher the intensity and time invested, the higher the energy consumption. Studies that are effective against promoting fat metabolism according to the intensity and form of exercise have reported that higher intensity is more effective, regardless of the form of exercise. Thus, it can be seen that various aerobic exercises, such as low-intensity to high-intensity, sustained liquor, and interval workouts, increase energy consumption and effective in improving physical function [7-10].
In addition to the effective energy consumption generated by exercise, excess post-exercise oxygen consumption (EPOC) is highlighted as oxygen consumption increases due to constant metabolic action to return increased metabolic activity to a stable level during exercise [11,12]. EPOC is visibly activated within 1 h immediately after exercise and plays an important role in recovering ATP-PCr in the muscles, replenishing blood and muscle oxygen, as well as redistributing ions (elevated sodium-potassium pump activity), recovering damaged tissues, normalizing elevated heart rate and body temperature, and eliminating lactic acid. During the recovery period, EPOC was reported to account for 14–15% of total oxygen consumption during exercise [13], highlighting the clinical importance of EPOC, which was reported to be greatly affected by exercise intensity and exercise time [14-16].
However, to measure energy consumption during and after exercise, a metabolic gas analyzer must be used to measure energy consumption by analyzing oxygen and carbon dioxide concentrations [17]. Using the metabolic gas analyzer, the method is highly accurate, but it is difficult for ordinary people to easily apply it to their daily life because it requires a lot of cost and time and is inappropriate for large-scale research. Recently, it has been used to estimate exercise intensity or PA during sports, work, or daily activities through heart rate [18]. Heart rate is based on a linear relationship between oxygen consumption and is one of the easiest, non-invasive, and most efficient and economical means of estimating energy consumption, providing effective data to predict the energy consumption of various types of activity [19,20]. The equipment required to measure the energy consumption of EPOC is expensive, sensitive to ambient humidity and temperature fluctuations, or expensive to maintain; therefore, it is important to utilize an economical and effective to estimate energy consumption. However, most prior studies use actual measured data using a metabolic gas analyzer, and there is a lack of research to estimate EPOC [13-16].
As described above, to analyze the energy consumption during and after exercise, it is difficult to apply the measured value to the actual field because the laboratory obtains the measured value using the metabolic gas analysis method. Therefore, it is important to develop a simple and accurate energy consumption estimation equation to measure and evaluate various activities during and after exercise. Currently, both domestically and internationally, regression models for estimating energy consumption during exercise have been reported, but there are almost no studies presenting a regression model after estimating the energy consumption of EPOC after exercise. As a regression model was developed using weight and heart rate, it is important to develop a regression model using various dependent variables for EPOC.
Therefore, this study proposes a regression model that estimates EPOC energy consumption using heart rate and various variables based on measuring the energy consumption of EPOC after various types of exercise in Korean adults (male and female). It can be used for effective exercise programs and PA guidelines for health promotion and obesity prevention and can be easily applied in the field.
METHODS
Subjects
A total of 75 participants (31 males and 44 females) were included in the present study (Table 1). Subjects who met one or more of the following exclusion criteria were not eligible to participate in the study: unstable angina, recent cardiac infarction (<4 weeks), uncompensated heart failure, severe valvular illness, pulmonary disease, uncontrolled hypertension, kidney failure, orthopedic/neurological limitations, cardiomyopathy, planned surgery during the research period, reluctance to sign the consent form, drug or alcohol abuse, or involvement in another study. In addition, there were no orthopedic problems in the pre-screening surveys, and they were those who did not have problems with the exercise test. All subjects were fully briefed on the pre-test study and only those who voluntarily agreed to participate. All procedures of the study were approved by the Institutional Review Board of Konkuk University (7001355-201903-HR-305) in Korea and were conducted following the Declaration of Helsinki.

Characteristics of subjects
Experimental design
To test the EPOC during and after continuous exercise (CEx), interval exercise (IEx), and accumulation of short-duration exercise (AEx), we used a crossover design. This approach entailed gathering data from the completed three training sessions by the participants on separate test days in a randomized order. Each participant visited the laboratory four times. On the first visit, body composition tests (InBody 770, Biospace Ltd, Seoul, Korea) and maximal cardiopulmonary exercise test (Quark CPET, Cosmed, Italy) were performed. At the second visit after at least 72 h, CEx (VO2max 60%, 1 × 30 min), AEx (VO2max 60%, 3 × 10 min), and IEx (VO2max 40% or 80%, 26 min) were performed at random, and the next visit was performed at intervals of 1 week. As soon as the CEx, AEx and IEx sessions ended, participants came down from the cycle ergometer and, while sitting on chairs, the EPOC was measured for 60 min.
Body composition
Body height, body mass index (BMI), body weight, fatfree mass (FFM), fat mass, and % body fat were measured using bioelectrical impedance analysis equipment (InBody 770, InBody, Seoul, Korea). The participants were asked to wear light clothing and remove metal items and were measured by standing upright barefoot on the machine platform, placing their feet on the electrode of the platform, while their hands gripped the wires on the handles.
Maximal exercise test
The participants underwent a maximal aerobic exercise test using a cycle ergometer (Aerobike, Combi 75 XL, Tokyo, Japan) to determine VO2max. The work rate at 50 rpm was 50 W for males and 25 W for females for the first 2 min and increased by 25 W for males and 12.5 W for females every 2 min until exhaustion or until participants were unable to maintain 50 rpm. The criteria used for achieving VO2max are a plateau in oxygen consumption as workload increases, a respiratory exchange ratio (RER) greater than 1.15, and maximal HR within 10 beats/min of the age-predicted maximum (220 – age). All participants met the first two criteria. Participants’ heart rates were measured using a Polar V800 monitor (Polar Electro, Kempele, Finland).
EPOC
All subjects were required to avoid vigorous exercise within 48 h and arrive at the laboratory early in the morning (8:00 AM) after overnight fasting (≥8 h) and rested for 30 min. Next, a standardized breakfast (two pieces of bread (200 kcal), one boiled egg (80 kcal), one cup of orange juice (120 kcal), and one cup of water) was eaten, and the experiment was conducted after resting for 2 h. The ambient room temperature was maintained at 23 ± 1°C. After 10 min of quiet sitting, VO2, ventilation, and RER were measured for 5 min, with the average used as the baseline.
The participants performed CEx, AEx, and IEx on a cycle ergometer. To measure CEx, AEx, and IEx, after entering the speed according to the participant’s exercise intensity on the bicycle, a gas analyzer was worn. CEx was performed at 60% of VO2max for 1 × 30 min, and AEx was performed for 10 min. AEx was measured three times per day at 10:00, 13:00, and 16:00. When participants completed each AEx morning session, they were allowed to rest until the next exercise session and measurement time. IEx was performed at 80% VO2max for 2 min during the first time. This was followed by exercise at 40% VO2max for 1 min and at 80% VO2max for 3 min, repeated six times for a total of 26 min. Immediately after the exercise, participants were seated in a chair, while relative VO2, absolute VO2, kcal, HR, and duration were monitored continuously for the first 60 min of recovery. The criterion for EPOC value determination was set at the time when VO2, HR, and RER values returned to the resting BASE. When the measurement was completed, all equipment was removed (Figure 1).
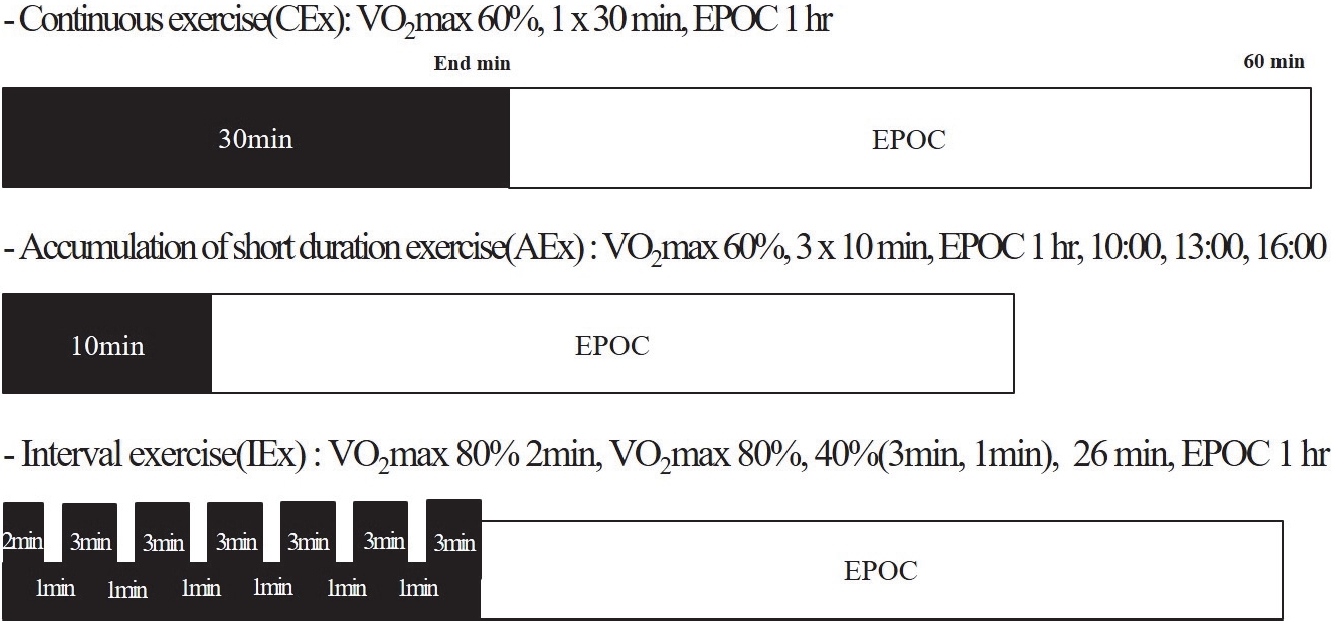
Exercise protocol by type of exercise.
Statistical analysis
The means and standard deviations were calculated for all measured parameters. The Shapiro-Wilk test verified the normal distribution of all outcome variables. To perform the linear regression analysis, we verified the independent variables by checking the regression coefficient (β-value). Regression analysis using the stepwise method was used to predict the EPOC based on sex, age, height, weight, BMI, FFM, fat mass, % body fat, and heart rate_sum (HR_sum). A two-tailed Student’s paired t-test was used to detect the differences between the measured and predicted EPOC. The authors rigorously conformed to the basic assumptions. Bias was calculated as the difference between the measured and predicted EPOCs. The authors rigorously conformed to the basic assumptions of a regression model (linearity, independence, continuity, normality, homoscedasticity, autocorrelation, and outlier). Statistical Package for the Social Sciences (SPSS) version 25.0 (IBM Corporation, Armonk, NY, USA) was used for the statistical analysis, and the level of significance (p-value) was set at 0.05.
RESULTS
Correlation between dependent variables and measured EPOC
The absolute value of the standard residual was set to ≥3 to confirm the singular value, and there were no outlier data in the EPOC prediction model. Our study estimated the regression model using a stepwise method, and the correlation between the measured EPOC and the dependent variables is shown in Table 2.

Correlation between dependent variables and measured EPOC for estimating the regression model
Significance of regression models and independent variables
The importance of each model was determined using an F test, and a t-test was used to determine the significance of the regression coefficients of the independent variables. Based on the exploratory data analysis results, it was statistically significant when we developed an integrated regression model using the independent variables (FFM and HR_sum) selected from the regression analysis results of the EPOC estimation of each exercise type (Table 3).

Significance level of the regression coefficient of the independent variable for each estimated regression model
Performance evaluation of regression models and regression equations
This study calculated the coefficients of determination (R2), adjusted coefficient of determination (adjusted R2), and standard errors of estimates (SEE) for the regression model. The regression model of the EPOC of each exercise type was developed as FFM and HR_sum, with the mean explanatory power of the CEx regression model was 86.3% (R2) and 85.9% (adjusted R2), and the mean SEE was 11.73 kcal. The mean explanatory power of the IEx regression models was 83.1% (R2) and 82.6% (adjusted R2), while the mean SEE was 13.68 kcal. The mean explanatory power of the AEx regression models was 91.3% (R2) and 91.0% (adjusted R2), while the mean SEE was 27.71 kcal (Table 4).

Estimated regression equations are predicting EPOC of Korean adults
Difference between measured and predicted EPOC of Korean adults
In this study, there was no significant difference between EPOC for each type of exercise measured using a metabolic gas analyzer and the EPOC predicted by the equation. The mean bias between the measured EPOC and predicted EPOC equations were CEx = 0.06 kcal, IEx = -0.08 kcal, and AEx = -0.04 kcal, respectively (Table 5). The measured and predicted EPOC showed a similar average value, and their correlation coefficients also showed a significant correlation (CEx: R = 0.929, p = 0.000, IEx: R = 0.912, p = 0.000, and AEx: R = 0.955, p = 0.000) (Figure 2).

Estimated regression equations are predicting EPOC of Korean adults
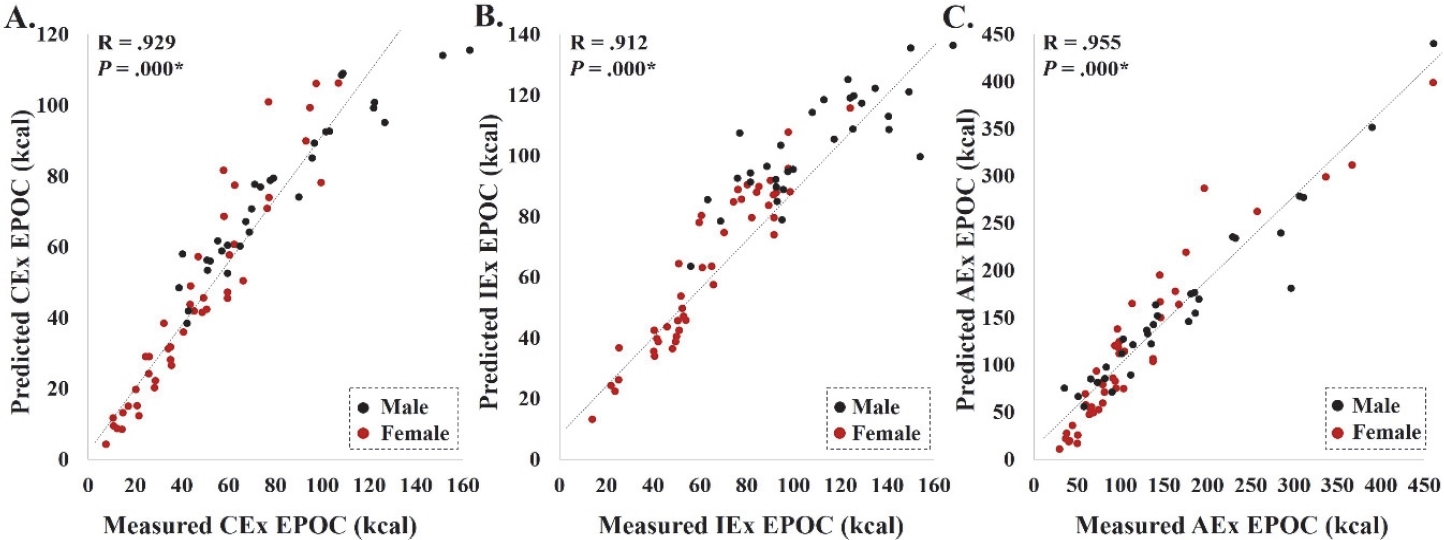
Scatter plot between measured and predicted EPOC.
Note: CEx, continuous exercise; IEx, interval exercise; AEx, accumulation of short-duration exercise; EPOC, excess post-exercise oxygen consumption.
DISCUSSION
Regular exercise is an effective way to consume energy, and EPOC after exercise also has an important effect on health promotion. EPOC refers to oxygen deficiency during exercise and the energy used for body recovery after exercise [16]. It restores ATP-PCr in muscles, replenishes blood and muscle oxygen, and redistributes ions (increased sodium-potassium pump activity). It plays a role in repairing damaged tissue, normalizing elevated heart rate and body temperature, and removing lactic acid [21,22]. EPOC was the highest level immediately after exercise and decreased with time. As such, EPOC is as effective in energy consumption as energy consumption during exercise, so an accurate and precise means of evaluating the amount of exercise of optimal energy consumption required for health promotion is required [11]. Currently, a metabolic gas analyzer must be used to measure the energy consumption of EPOCs, but it cannot be easily used in the field. Therefore, developing an EPOC energy consumption regression model is an important item to be considered. In particular, it has been reported that individual characteristics, such as age, sex, and weight, should be considered, although an easily measurable HR is used to estimate VO2 [23]. Most of the studies using heart rate have been used in regression models that estimate energy expenditure of exercise in active energy, and none of the regression models that estimate the energy expenditure of EPOC have been studied using heart rate. Therefore, we propose a method for measuring EPOC energy consumption and estimating the energy consumption of the heart rate and various variables.
In this study, a preliminary study was conducted to develop a regression model to estimate the energy expenditure of EPOC in Korean adults using various dependent variables that are easy to measure. Based on the collected data, we developed a regression model of EPOC for each exercise type (CEx = -37.128 + 1.003 × (FFM) + 0.016 × ((HR_sum), IEx = -49.265 + 1.442 × (FFM) + 0.013 × (HR_sum), and AEx = -100.942 + 2.209 × (FFM) + 0.020 × (HR_sum)).
It is important to eliminate anomaly values that increase prediction errors before developing regression models that estimate the EPOC. In the regression, we used the absolute value of the standardized residuals to determine outliers, and as a result, no outliers were observed in this study; therefore, it demonstrated clear linearity between the independent and dependent variables.
When examining the correlation between EPOC energy consumption of various exercise types and various dependent variables in Korean adults, heart rate and various measurement variables showed a significant correlation with EPOC (e.g., sex, age, height, weight, BMI, FFM, % body fat, and HR_sum) in various exercise types (Table 2). However, autocorrelation and multicollinearity were observed in all dependent variables except FFM and HR_sum; therefore, various exercise types EPOC regression models using FFM and HR_sum were developed using the stepwise method. The developed equations indicated that 86.3% (CEx equation), 83.1% (IEx equation), and 91.3% (AEx equation) of the variance in the criterion variable of EPOC was attributable to the variance of the combined predictor or independent variables.
Previously, Charlot et al. [24] developed a regression model to estimate energy expenditure of exercise using heart rate (EE (kcal/h) = 171.62 + 6.87 × HR (bpm) + 3.99 × Height (cm) + 2.30 × weight (kg) −139.89 × Sex (1 or 2) − 4.26 × resting HR (bpm) − 4.87 × HRmax (bpm), R2 = 0.879). In addition, the studies of Keytel et al. [19] developed a regression model of energy expenditure during submaximal exercise in their 30s using heart rate (EE1 (kJ/min) = -59.3954 + sex × (-36.3781 + 0.271 × age + 0.394 × weight + 0.404 × VO2max + 0.634 × heart rate) + (1 – sex) × (0.274 × age + 0.103 × weight + 0.380 × VO2max + 0.450 × heart rate), R2 = 0.833, EE2 (kJ/min) = sex × (-55.0969 + 0.6309 × heart rate + 0.1988 × weight + 0.2017 × age) + (1 – sex) × (-20.4022 + 0.4472 × heartrate -0.1263 × weight + 0.074 × age), R2 = 0.734). The correlation coefficient of energy consumption, excluding the maximum oxygen intake, was 0.734; however, other regression models showed a correlation coefficient of 0.80 or higher, showing a high regression model. However, most studies have aimed to estimate energy consumption during exercise or to estimate the maximum oxygen intake. This study is difficult to compare accurately because it is a study to measure energy consumption after exercise, but it is considered comparable to that of a study using heart rate.
In addition, the most common method of estimating energy consumption is using an accelerometer, and some studies using heart rate monitoring equipment have also been reported. In the case of accelerometers, energy expenditure measurements show a high correlation between actual measurements, but it has been reported that the evaluation of low PA or restricted movement is underestimated or overestimated [25,26]. Heart rate monitoring equipment is said to have variability because it needs to be calibrated [27]. As described above, to use the heart rate monitoring equipment, it is necessary to obtain accurate data, so it is considered that a study to develop a heart rate sensor for estimating energy consumption is also necessary [28].
In this study, a regression model with a high correlation coefficient was proposed using the FFM and heart rate among various variables. In a study by Bot & Hollander [29], the relationship between VO2 and HR was affected by FFM when performing various types of exercise, and Lothian and Farrally [30] found that the heart rate and VO2 during interval exercise have a significant linear relationship. As such, heart rate and FFM influence each other and are considered effective variables in estimating EPOC energy consumption in various types of exercises. However, this study has some limitations as a preliminary study. The sample size was small, and we were unable to develop a regression model for the sexes, and validity tests could not be performed. Therefore, further research is required to overcome these limitations.
In conclusion, through preliminary experiments, we developed a regression model using heart rate and various variables to estimate the energy expenditure of various exercise types of EPOC in healthy Korean adults. The developed model is as follows: CEx = -37.128 + 1.003 × (FFM) + 0.016 × (HR_sum), IEx = -49.265 + 1.442 × (FFM) + 0.013 × ((HR_sum), and AEx = -100.942 + 2.209 × (FFM) + 0.020 × (HR_sum). The bias between the estimated EPOC and measured EPOC (CEx = 0.06, IEx = -0.08, and AEx = -0.04), and correlation (CEx: R = 0.929, IEx: R = 0.912, and AEx: R = 0.955) were reasonable.
Acknowledgements
This work was supported by the Ministry of Education of the Republic of Korea and the National Research Foundation of Korea (NRF-2019S1A5B8099542).