


INTRODUCTION
In 1998, obesity was classified by the U.S. National Institutes of Health (NIH) and the World Health Organization (WHO) as a disease, which has been established as a vital health concern. Since the 2000s, studies have focused on the prevention of obesity rather than its treatment [1]. The prevalence of obesity has steadily risen from 0.7% in 1975 to 5.6% in 2016, with recent trends showing stabilized BMI levels in Northwestern Europe and high-income English-speaking regions but a noticeable increase in East Asia, South Asia, and Southeast Asia [2]. The comparison of data from 2007 to 2009 with those from 2013 to 2015 revealed that the daily total fat intake of Korean children increased from 47.4 g to 60.6 g, and their daily total caloric intake increased from 1935 kcal to 2004 kcal [3]. Obesity in children aged 7 to 11 years considerably increases their health risks in adulthood; for instance, the risks of developing diabetes, coronary artery disease, and hypertension increase by 78%, 14%, and 67%, respectively [4]. Therefore, further studies are warranted to address this issue.
Childhood obesity is largely influenced by genetic factors, but environmental factors, such as lifestyle habits, also play a crucial role [5]. Particularly in children, an increase in media exposure has led to a more sedentary lifestyle. For every additional hour of TV viewing, the prevalence of obesity increases by 2% [6]. Physical activity is a direct indicator that influences obesity in children. Those who engage in low levels of moderate to vigorous physical activity or have a low total amount of physical activity tend to have high rates of obesity [7]. When the recommended levels of physical activity are not satisfied, obesity and metabolic syndrome may develop. In children with obesity, fat tissues tend to accumulate primarily around the abdomen [8], resulting in increased triglyceride (TG) levels and decreased high-density lipoprotein cholesterol (HDL-C) levels [9].
Adipocytes not only participate in lipid metabolism but also release adipokines, which are active mediators that affect blood coagulation, blood pressure, glucose metabolism, inflammation, and atherosclerosis [10]. Among adipokines, leptin level is proportional to the amount of adipose tissue, and it increases in the case of obesity. Conversely, it decreases with weight loss [11]. Insulin resistance is also relatively higher in children with obesity than in children with normal weight [12]. These characteristics are highly correlated with physical activity levels. A high physical activity level is inversely related to the reduction of blood lipid levels [13], insulin resistance [14], and leptin [15] and resistin levels [16].
In recent studies, physical activity levels are measured using accelerometers instead of relying solely on surveys. However, most of these studies have focused on adults [17] or compared individuals with obesity and normal weight [18]. Additionally, studies have performed comparisons of different physical activity levels [19], but they have been unable to conclusively determine whether physical activity can offset the negative effects of obesity in children. Therefore, studies should directly measure the physical activity levels of children with obesity and analyze obesity-related variables to obtain more objective results.
This study was performed to investigate the differences in blood lipids, insulin resistance, and adipokines according to the physical activity levels of children with obesity. The following hypotheses were established. First, the higher the physical activity levels of children with obesity, the lower the levels of TG, total cholesterol (TC), and low-density lipoprotein cholesterol (LDL-C) and the higher the levels of HDL-C. Second, the higher the physical activity levels of children with obesity, the lower the levels of insulin resistance. Third, the higher the physical activity levels of children with obesity, the lower the levels of leptin and resistin.
METHODS
Participants
The participants for this study were selected from 7-to 11-year-old elementary school students whose body mass index (BMI) was above the 95th percentile in accordance with the criteria for evaluating obesity in children and adolescents from the 2017 Korean Pediatric Growth Charts [20]. They were recruited in the city of S by distributing public notices, ensuring that the students and their parents were fully aware of the purpose and intent of the study and had consented to participate. The calculated sample size was 180 [21] based on G*Power version 3.1.9.2 Windows program (Kiel University, Kiel, Germany), with an effect size of 0.25 (default), significance level of 0.05, and power of 0.50. A total of 200 participants were selected while anticipating dropouts. The study participants underwent medical examinations, anamnesis, and physical tests to ensure that they had no musculoskeletal or neurological disorders, had not taken any medication in the past 6 months, and did not have any factors that could affect the experiment. Before the experiment, the purpose and intent of the research were thoroughly explained to the participants, and the study was performed with voluntary participation and consent forms from the subjects and their parents. The research plan, which complied with the ethical principles and guidelines of the Helsinki Declaration, was approved by the Institutional Review Board (IRB) of Seoul National University (No. 2308/002-009). A total of 197 participants were included after 3 dropouts were excluded. The physical characteristics of the participants are presented in <Table 1>.
Study Design
A cross-sectional analysis was conducted to examine the differences in blood lipids, insulin resistance, and adipokines based on the physical activity levels of children with obesity. Physical activities equivalent to 7 days were measured and classified into the following to categorize physical activity levels: sedentary time (ST), light physical activity (LPA), and moderate to vigorous physical activity (MVPA). Blood lipids were analyzed to determine TG, TC, LDL-C, and HDL-C. Insulin resistance was assessed using the HOMA-IR formula, and adipokines were analyzed focusing on leptin and resistin to identify the differences between groups. We study flow is shown in <Figure 1>.
Measurement
Anthropometry
Body weight (kg) and height (cm) were measured using a digital height meter (BSM370, Inbody, Seoul, Korea). Body fat mass (kg), body fat percentage (%), and muscle mass (kg) were measured using a bioelectrical impedance analysis device (Inbody 270, Inbody, Seoul, Korea). The Body Mass Index (BMI) was calculated using height and weight (kg/m2).
Physical activity level
Physical activity levels were measured using an accelerometer (wGT3X-BT, Actigraph, Florida, USA), which is a device widely used in research because of its validated reliability for the objective measurement of children’s physical activities [22]. The device was worn on an elastic belt over their right hip bone and on the wrist for a total of 168 h except when the participants were showering over a period of 7 days. It was initialized at a sampling rate of 30 Hz, and data were collected at an interval of 60 s to record the participants’ free-living activities. Physical activity levels were categorized using average counts per minute (CPM): sedentary, 0-100 CPM; LPA, 101-2295 CPM; moderate physical activity, 2296-4011 CPM; vigorous physical activity, >4012 CPM; and MVPA, >2296 CPM [23]. The participants were thoroughly briefed about the precautions when wearing the accelerometer and were instructed to perform their usual activity levels without being conscious of the device to ensure reliability.
Blood sampling
Blood lipid analysis was performed to determine the levels of TG, TC, HDL-C, and LDL-C. Blood samples (10 ml) were collected by a registered nurse from the antecubital vein and then centrifuged using a Combi-514R centrifuge (Hanil, Korea) at 3000 rpm for 10 min before analysis. Insulin resistance was calculated using the HOMA-IR method based on the following formula [24]: HOMA-IR = [fasting plasma insulin (Uu/ml) × fasting plasma glucose (ml/dl)] / 405. Leptin levels were measured from the separated serum by using a leptin ELISA kit DSL (USA), and resistin was analyzed using an antibody enzyme-linked immunoassay kit (Bio Vendor Laboratory Medicine, USA) and subjected to an enzyme-linked immunosorbent assay (ELISA, Hitached 747 analyzer, Tokyo, Japan) [25]. All measurements, excluding physical activity levels, were taken after maintaining a fasting period of at least 8 hours. Measurements were conducted between 8 and 10 a.m. with participants in a state of metal removal and light clothing.
Statistical analysis
Data were analyzed using IBM SPSS Statistics ver. 27 (IBM, Armonk, NY, USA), and the mean and standard deviation were calculated. One-way ANOVA was performed to examine the differences in blood lipids, insulin resistance, and adipokines according to the physical activity levels of children with obesity, and Scheffe’s method was conducted as a post hoc test. Statistical significance levels were set at p<.05.
RESULTS
Classification According to the Physical Activity Levels of Children with Obesity
The classification of the physical activity levels of children with obesity based on a 7-day measurement period is presented in <Table 2>.
Differences in Blood Lipids According to the Physical Activity Levels of Children with Obesity
The comparison of blood lipid levels (TG, TC, HDL-C, LDL-C) according to the physical activity levels classified as ST, LPA, and MVPA in children with obesity is shown in <Figure 2>. A significant difference in TG, TC, HDL-C, and LDL-C was observed across all variables according to the overall physical activity levels of the children with obesity. Post-analysis results showed that MVPA had lower levels of TG (87.39±42.58, p<0.01), TC (171.34±33.04, p<.01), LDL-C (110.54±10.39, p<.001) compared to ST and LPA, and higher HDL-C (53.74±9.47, p<.05) compared to ST and LPA.
Differences in Insulin Resistance According to the Physical Activity Levels of Children with Obesity
The comparison of insulin resistance (HOMA-IR) according to the levels of physical activity classified as ST, LPA, and MVPA in children with obesity is shown in <Figure 3>. The insulin resistance levels, MVPA (2.28±1.65), LPA (2.45±1.25), and ST (2.65±1.88) did not show significant differences in all physical activity levels of the entire group of children with obesity.
Differences in Adipokines According to the Physical Activity Levels of Children with obesity
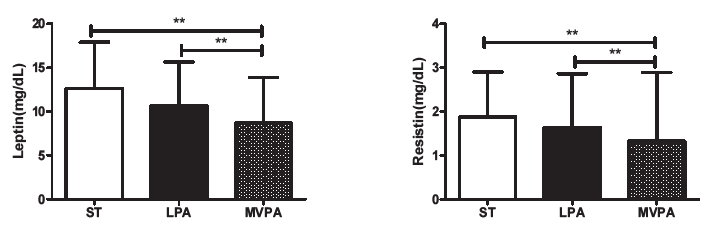
The comparison of adipokines (leptin and resistin) according to the physical activity levels classified as ST, LPA, and MVPA in children with obesity is shown in <Figure 4>. Leptin and resistin significantly differed according to the physical activity levels of the entire group of children with obesity. Post-analysis results indicated that the leptin (8.69±5.21, p<.01) and resistin (1.32±1.57, p<.01) levels of children with MVPA were significantly lower than those of children with ST and LPA.
DISCUSSION
This study aimed to investigate the differences and relationships in blood lipids, insulin resistance, and adipokines according to the physical activity levels of children with obesity. It involved 197 children with obesity aged 7-11 years. The hypothesis was TG, TC, HDL-C, LDL-C, HOMA-IR, leptin, and resistin levels would differ according to physical activity levels. The results showed that the levels of TG, TC, LDL-C, leptin, and resistin were lower in the MVPA group than in the ST and LPA groups, while HDL-C levels were higher in the MVPA group than in the ST and LPA groups.
Physical activity in childhood is associated with a dose-response relationship in which higher physical activity levels provide increased health benefits. Therefore, children are recommended to engage in at least 60 min of muscle- and bone-strengthening activities per day, especially for children who have obesity and are at a high risk to gain more health benefits [26]. Regular physical activity can enhance the lean body mass and cardiorespiratory fitness of children with obesity and consequently improve blood pressure, atherosclerosis, abdominal fat, and blood lipids [27]. Conversely, a decrease in physical activity can increase the prevalence of metabolic syndrome [28]. However, previous studies using objective physical activity indicators found that childhood physical activity levels have a strong positive correlation with HDL-C regardless of obesity levels. However, the relationship with other blood lipids could be weaker than commonly thought [29]. Specifically, HDL-C is only positively correlated with MVPA levels during childhood, while relationships with other variables may be unclear [19]. Furthermore, studies on normal-weight children revealed that self-reported physical activity levels have no significant association with blood lipids [30].
These results indicated potential errors because of measurement devices, methods, and subject variability, suggesting that more objective measurement techniques should be used. Nonetheless, the importance of physical activity has been proven in many studies. Cai and Wu reported that obesity prevention programs that aim to increase physical activity can further improve LDL-C, HDL-C, and TG levels in children with obesity compared with those of normal-weight children [31]. In children with hyperlipidemia, sedentary lifestyle has a strong positive correlation with TG levels [32], and aerobic fitness, an indicator of physical activity, positively affects blood lipid levels [33]. Furthermore, the results of the present study demonstrated the importance of physical activity in children with obesity, showing healthier levels of blood lipids in the group with MVPA.
Increased insulin levels and insulin resistance are prominent characteristics of obesity [34]; obesity and insulin resistance are strong predictors of coronary artery disease. Particularly, insulin resistance accompanying obesity further increases the risk of coronary artery disease and type 2 diabetes [35]. However, physical activity increases irisin, which induces the browning of white adipose tissue and consequently helps prevent obesity and diabetes. It also improves insulin resistance by increasing energy expenditure and promoting weight loss [36]. Insulin and insulin resistance are negatively correlated with MVPA but are positively correlated with sedentary lifestyles [37]. Moreover, studies involving children with obesity and normal-weight children have reported that physical activity is highly correlated with insulin and insulin resistance [38]. A notable difference from this study is that physical activity was analyzed over a period of 4 days and that children with obesity and normal-weight children were included.
Conversely, other studies have shown that physical activity levels are negatively correlated with insulin in normal-weight children, but they have not found a significant association in children with obesity [30]. Similarly, in the present study, insulin resistance had no significant differences according to the physical activity levels of children with obesity. This finding was consistent with the results of Haapala, Wiklund [37], who suggested that insulin resistance does not differ in children with higher body fat percentages although insulin resistance may vary depending on obesity and physical activity levels. Therefore, the body weight of children with obesity may have a greater effect on insulin than on physical activity.
Leptin and resistin, which are hormones secreted from adipose tissues, are associated with the regulation of insulin action [39,40]. However, in the present study, higher physical activity levels were associated with lower leptin and resistin levels regardless of differences in insulin resistance. Other studies have also demonstrated that resistin is not significantly associated with insulin resistance in children and adolescents [41]; although leptin is related to insulin resistance in children, this relationship weakens when adjusted for obesity [42]. Studies have also indicated that exercise in adolescents with obesity can increase adiponectin levels and decrease leptin and resistin levels [43,44]. These findings support the results of the present study, suggesting that adipokines, such as leptin and resistin, can be considered early indicators of obesity in children, and they require more stringent monitoring than general obesity indicators [45].
Before the results of this study could be interpreted, several potential limitations should be considered. The study targeted children with obesity aged 7-11 years, which covers a period of rapid hormonal and physiological changes associated with growth, and such changes cannot be controlled. Second, the subject’s dietary intake was not investigated. Thirds, in this study, the sample size according to the physical activity level of obese male and female children seems to be relatively small. Nevertheless, in this study, objective indicators were used to measure physical activity over a period of 7 days, and differences in metabolic indicators were examined according to the physical activity levels of children with obesity; therefore, these data could serve as a basis for the physical activity levels of children.
The study found that children who have obesity and maintain MVPA have blood lipid, insulin resistance, and adipokine levels that are close to or at normal levels. Therefore, enhancing physical activity levels during childhood is a crucial means to maintain metabolic health despite obesity.