Accelerometer-derived physical activity and sedentary behavior patterns among Korean adults
Article information
Abstract
[Purpose]
This study aimed to provide an overview of accelerometer-derived physical activity (PA) and sedentary behavior (SB) patterns among Korean adults. We also investigated the association between participant characteristics and the likelihood of adherence to moderate-to-vigorous physical activity (MVPA), SB, and the MVPA-SB guidelines.
[Methods]
Data from the 2014-2017 Korea National Health and Nutrition Examination Survey were used. The study involved a nationally representative sample of 2,260 Korean adults aged ≥20 years. Accelerometers were used to measure PA and SB for seven days. Multivariate logistic regression models were used to assess the association between the participant characteristics and the likelihood of adhering to the MVPA, SB, and MVPA-SB guidelines.
[Results]
SB (60.61%), light intensity (26.22%), and lifestyle activities (9.4%) accounted for the majority of the participants’ days. MVPA and vigorous physical activity (VPA) accounted for 3.72% and 0.06% of the days, respectively. The MVPA guidelines were more likely to be adhered to by men, older adults, participants with higher education, non-smokers, and individuals without multimorbidity. Participants with higher education and household income were less likely to adhere to the SB guidelines. Women (OR=0.51), participants with high education levels (OR=0.54), current smokers (OR=0.47), and patients with multimorbidity (OR=0.46) were less likely to adhere to the MVPA-SB guidelines.
[Conclusion]
This study found that participants were predominantly sedentary, with only a small proportion engaging in VPA. There were differences related to demographic factors and health status. Most Korean adults do not adhere to the recommended MVPA-SB guidelines, and that is a serious public health concern. These findings highlight the need to promote PA and reduce SB through public health policies and interventions, particularly for adults facing PA barriers.
INTRODUCTION
Health and well-being are crucially influenced by moderate to vigorous physical activity (MVPA) and sedentary behavior (SB). Regular physical activity (PA) reduces the risk of chronic diseases such as obesity, type 2 diabetes, and cardiovascular diseases; improves mental health; and enhances the overall quality of life [1-6]. Conversely, excessive SB, which is characterized by prolonged sitting or reclining activities with low energy expenditure [7], has been associated with negative health outcomes, including an elevated risk of obesity, cardiovascular disease, mortality, and poor mental health [1,8-11].
Assessing PA and SB patterns in specific populations is essential to understanding their trends and informing public health interventions that promote active lifestyles and reduce SB [12]. Accurately measuring PA and SB can provide valuable insights into the quantity, intensity, and patterns of these behaviors in different settings, populations, and periods. Traditional self-reporting methods such as questionnaires cannot accurately capture PA and SB patterns due to potential recall, social desirability, and misclassification errors [13,14].
Accelerometers have recently emerged as reliable and valid tools for objectively assessing PA and SB in free-living conditions [15-17]. These are small devices worn on the body to detect and quantify movements, which provide detailed information on PA, including intensity, duration, and frequency. They have been used to assess the PA and SB patterns in various populations, including children, adults, and older adults in different countries and cultures [17-19].
However, studies on accelerometer-derived PA and SB patterns in Korean adults are limited. Further studies are needed to better understand the prevalence, correlates, and health implications in this population. A recent Swedish CArdioPulmonary BioImage Study (SCAPIS), which examined accelerometer-assessed patterns of PA and SB in a sample of 27,890 middle-aged adults (aged 50-64 years), revealed that SB accounted for 54.5% of the total accelerometer wear duration, whereas MVPA accounted for only 5.5% of the total duration [20]. Moreover, optimal health outcomes can be achieved by increasing PA and reducing SB. Engaging in regular PA improves fitness and prevents chronic diseases, while reducing SB mitigates the harmful effects of physically inactivies and low-ers the risk of SB-associated health issues [8,21]. PA and SB are important determinants of health; therefore, addressing them in both research and practice is crucial for promoting overall health and well-being.
An association between accelerometer-based PA and SB and chronic diseases, such as metabolic disease and obesity, has been reported [22]. However, the criteria for adhering to the MVPA-SB guidelines are not fully understood.
Therefore, this study aimed to provide an overview of accelerometer-derived PA and SB patterns in Korean adults using data from the Korean National Health and Nutrition Examination Survey (KNHANES). We also investigated the association between participant characteristics and adherence to the MVPA, SB, and MVPA-SB guidelines.
METHODS
Study participants
This study used data from the KNHANES, an annual national surveillance conducted by the Korea Disease Control and Prevention Agency (KDCA) to assess the health and nutritional status of the Korean population [23]. The survey consisted of health interviews, physical examinations, laboratory tests, and dietary assessments and was approved by the Institutional Review Board of the KDCA. For this study, data from the 2014 to 2017 KNHANES were used, with a focus on PA measurements collected using accelerometers (n=2,817). To ensure that the participants’ daily physical activity was accurately assessed, we only included participants whose data had been collected for a minimum of 10 hours per day for at least four days (n=2,270). We excluded two participants with incomplete demographic and lifestyle data, and eight participants with incomplete disease-related information, with 2,260 participants remaining for the final analysis.

Flow chart for inclusion and exclusion of study populations.
Accelerometer measures of physical activity and sedentary behaviors
A triaxial accelerometer (ActiGraph LLC, FL, USA) was used to assess SB and PA. All participants were informed about the survey, and they provided consent before receiving the survey guide and accelerometer. They were instructed to wear the accelerometer on the left or right side of their waist relative to their navel for seven consecutive days after providing consent. The accelerometer was set up to record data starting at midnight on the same day. The participants were also asked to wear the accelerometer during all schoolor work-related activities, but not during swimming or showering.
The ActiGraph GT3X+ accelerometer detects three-dimensional PA, including up–down, front-back, and leftright movements. Electrical signals were summarized at a frequency of 1-minute epochs, based on the PAs of the participants and the storage capacity of the accelerometer. Non-wear duration was defined as at least one minute of continuous zero counts. The duration of wear was calculated by subtracting any non-wear duration of more than 60 consecutive minutes. Records with less than 10 hours of wear duration per day for four days were considered invalid [18,24].
The mean value per valid day was computed from the accelerometer records to calculate the time spent on different levels of activity. SB, light-intensity activity, lifestyle activity, and MVPA were defined using thresholds of <100, <760, <2020 counts/min, and ≥2020 counts/min [17,25]. The classification procedure was based on a PA monitoring protocol and reports from previous studies [8,17,25].
Other measurements
This study examined whether socioeconomic factors, including age, sex, household income, education, and occupational status; lifestyle factors, such as smoking and alcohol consumption; and health-related factors, such as obesity and chronic diseases, are associated with PA and SB. Participants were categorized into three groups based on age: 20–39, 40–59, and ≥60 years. They were also classified into three groups based on their educational level: less than high school, high school, and higher than high school. Household income was categorized into quartiles for all the KNHANES participants. Occupational status was categorized into four: unemployed, professional, white collar, and blue collar. The participants were also divided as non-smokers, former smokers, and current smokers based on smoking status. The consumption of alcohol was categorized as non-drinking, drinking once a week, 2–3 times/week, and ≥4 times/week based on alcohol consumption. Body mass index (BMI, kg/m2) was calculated using height (m) and body weight (kg); a BMI of 25 or more indicated obesity based on the Korean Obesity Society guidelines. Chronic diseases were classified as multimorbid if two or more of the following diseases were self-reported to have been diagnosed: hypertension, diabetes, hyperlipidemia, arthritis, cardiovascular disease, and stroke [26].
Statistical analysis
All statistical analyses were performed using R 2.3.0 software, and statistical significance set at P<0.05. To generate nationally representative estimates, we employed a composite sample survey method that accounted for sample design and weighting.
Continuous variables such as age, BMI, PA, and SB were presented as weighted means and standard deviations. Categorical variables are presented as frequencies and weighted percentages.
Survey regression models were used to compare the time spent on MVPA, light-intensity activities, lifestyle activities, and SB according to the participant characteristics. The Rao-Scott chi-squared tests were used to compare adherence to the MVPA, SB, and MVPA-SB guidelines according to participant characteristics.
Survey logistic regression models were used to calculate the odds ratios (ORs) and 95% confidence intervals (CIs) for adhering to the MVPA, SB, and MVPA-SB guidelines. All logistic models were adjusted for the total duration of accelerometer wear, as well as sex, age group, educational level, household income, occupational category, alcohol consumption, smoking status, obesity, and multimorbidity as independent variables.
RESULTS
This study included 2,260 participants (851 men and 1,409 women) aged ≥20 years. The overall and sex-based characteristics are presented in Table 1. Their mean age was 51.47±0.73 years, and their mean BMI was 23.85±0.09 kg/m2. The prevalence of obesity and multimorbidity were 33.0% and 12.7%, respectively.

Characteristics of the study population.
The proportion and distribution of the duration spent on domain-specific PA and SB are shown in Figure 2. The results showed that SB accounted for most of the day (60.61%), followed by light-intensity (26.22%) and lifestyle activities (9.4%). The percentage duration of MVPAs was very low (3.78%), with VPA accounting for only 0.06% of the total duration of accelerometer wear (Figure 2). The distributions of SB, light, and lifestyle activities were nearly normal, whereas MVPA was skewed to the left owing to its low value (Figure 2).

Proportion and distribution of each physical activity parameter.
Figure 3 shows the mean durations of SB, light-intensity activity, lifestyle activity, and MVPA stratified by the characteristics and health status of the participants. The mean daily durations of SB, light-intensity activity, lifestyle activity, and MVPA were 473.49±4.73 min/day, 210.04±2.51 min/day, 76.41±1.51 min/day, and 16.10±0.83 min/day, respectively. The mean duration of SB was significantly higher for the older population and those with higher educational levels. Females had a significantly longer duration of light-intensity activity than males (P<0.001), and more males than females engaged in MVPA (P<0.001). The time spent in MVPA was significantly shorter for females, young adults, heavy alcohol consumers, smokers, and individuals with multimorbidities (All P<0.05).
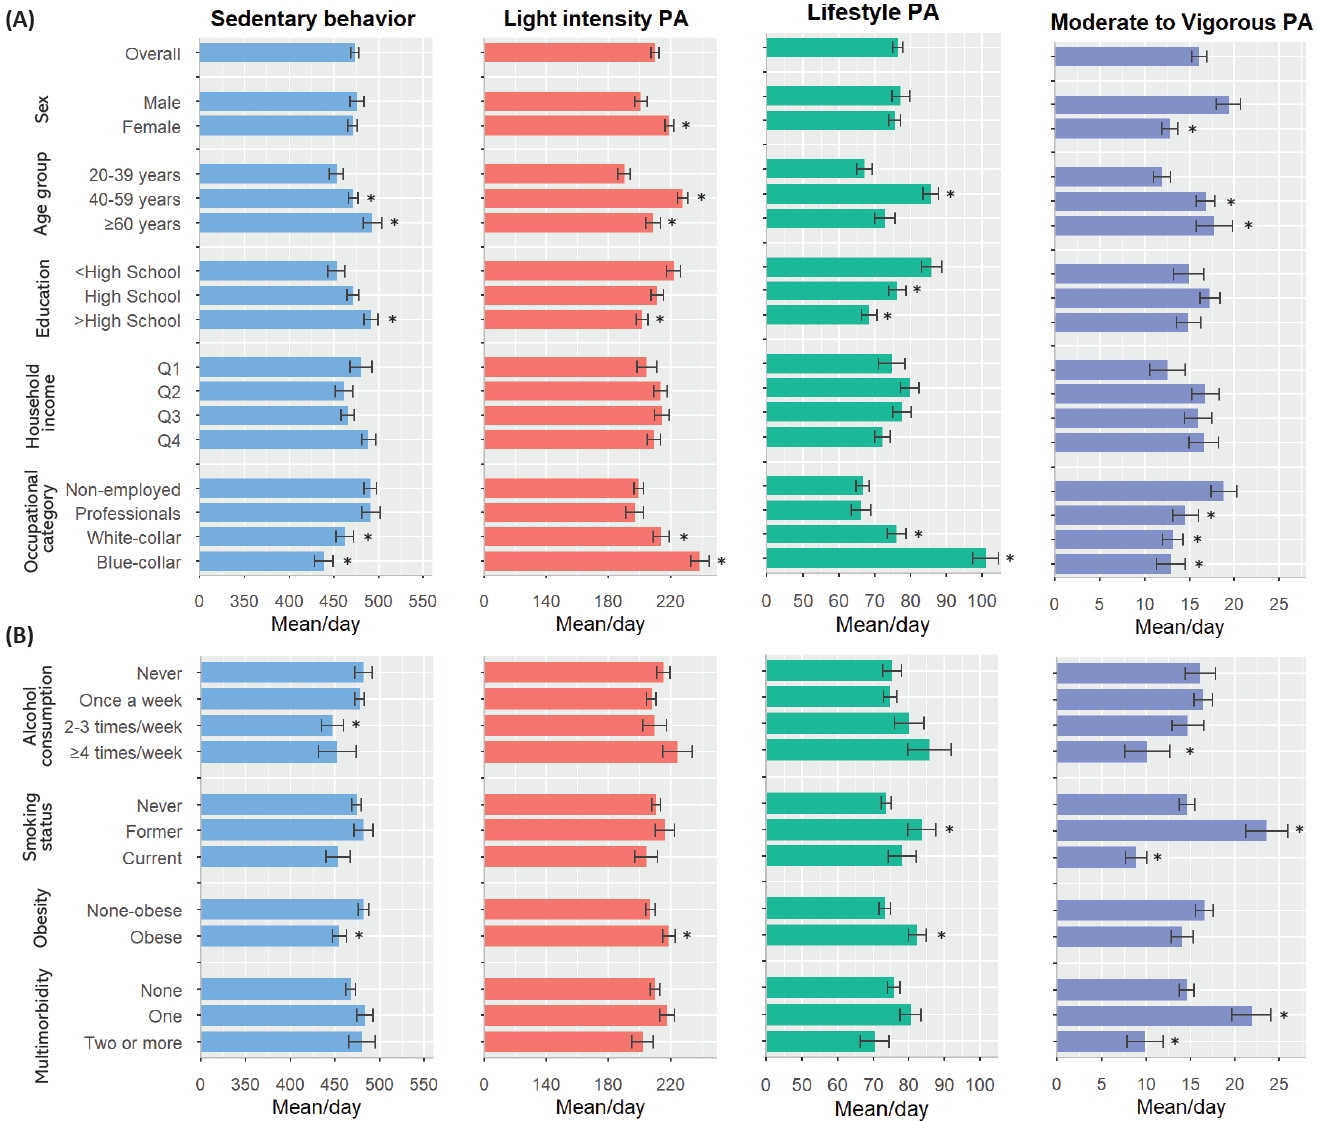
Mean durations of sedentary behavior, light-intensity activity, lifestyle activity, and moderate-to-vigorous physical activity, according to the characteristics of participants and health status.
Table 2 presents the proportion of individuals adhering to the MVPA, SB, and MVPA-SB guidelines. Overall, the proportions of individuals adhering to the MVPA, SB, and MVPA-SB guidelines were 23.4%, 49.5%, and 11.6%, respectively. Men, older adults, participants with higher educational level, non-smokers, and those without chronic diseases were more likely to adhere to the MVPA guidelines. Meanwhile, being highly educated, having a high household income, and having a healthy lifestyle (non-smoking and non-drinking) were associated with lower adherence to SB guidelines. Adherence to the MVPA guidelines was the lowest among the unemployed group and the highest among blue-collar workers (P<0.05). Adherence to the MVPA-SB guidelines was the lowest among women and individuals aged 20–39 years. Furthermore, multimorbid individuals were less likely to adhere to the MVPA-SB guidelines (Table 2).

Prevalence of adherence to guidelines for physical activity and sedentary behavior according to characteristics and health status.
Table 3 presents the relationships between adherence to the MVPA, SB, and MVPA-SB guidelines, patient characteristics, and health status demonstrated by multivariable logistic regression models. Sex, age, educational levels, household income, occupational category, and smoking status were significantly associated with adherence to the MVPA guidelines (Table 3, all P<0.05). Age, educational levels, household income, occupational category, and obesity were significantly associated with adherence to SB guidelines (Table 3, all P<0.05). Higher levels of education were associated with a lower OR (OR=0.49, 95%CI:0.35, 0.70), while higher household incomes were associated with a higher OR for adherence to SB guidelines (Table 3). In addition, a blue-collar occupation was associated with a higher OR for adhering to the SB guidelines (OR=1.68, 95%CI:1.25, 2.26) and a lower OR for adhering to the MVPA guidelines (OR=0.45, 95%CI:0.31, 0.65).

ORs (95% CI) of adherence to guidelines for physical activity and sedentary behavior according to characteristics and health status.
Furthermore, the factors associated with adherence to MVPA-SB guidelines were examined. Women had an OR of 0.51 (95%CI:0.34, 0.76) for adherence to MVPA-SB guidelines relative to men. Higher levels of education were associated with a lower OR (OR=0.54, 95%CI:0.32, 0.91), while higher household incomes were associated with a higher OR (OR=2.18, 95%CI:1.13, 4.23) for adherence to MVPA-SB guidelines. Current smokers had an OR of 0.47 (95%CI:0.25, 0.86) relative to non-smokers, and participants with multimorbidity had an OR of 0.46 (95%CI:0.24, 0.89) relative to those without chronic conditions.
DISCUSSION
This cross-sectional study revealed that 60.61% of PA patterns, as assessed by an accelerometer in a large population-based sample of more than 2,000 adult men and women, were classified as sedentary. Only 0.06% were classified as VPA. This study also revealed that lifestyle and health status accounted for variations in PA patterns across subgroups. Specifically, female sex, older age, heavy alcohol consumption, current smoking, occupational status, and chronic conditions were associated with shorter durations of MVPA. Moreover, higher age, higher education level, and non-employment were associated with longer durations of SB. Women, older participants, and highly educated participants spent more time performing LPA. According to our results, 76.6% of Koreans did not adhere to MVPA guidelines, whereas 50.5% failed to adhere to sedentary time guidelines. Only 11.6% of Koreans adhered to both guidelines simultaneously. Given the potential health benefits associated with meeting both sets of guidelines, addressing physical inactivity in the Korean population should be a top public health priority.
In this study, 90.9% of participants did not engage in any VPA; the average durations of MVPA and VPA were 16.10±0.83 and 0.3±0.07 min/day, respectively. The World Health Organization and international PA guidelines recommend at least 75 min/week of VPA or 150 min/week of MPA to maintain good health [27]. This study revealed that a very small proportion of Korean participants engaged in VPA, which may not be sufficient according to the recommended guidelines. Previous studies assessing PA have often analyzed MVPA without distinguishing it from VPA [28]. Based on the few studies that have assessed VPA, the level of VPA in Korean participants is low, whereas SB levels are high. Consistent with our findings, the SCAPIS cohort study, which investigated PA and SB patterns measured using an accelerometer in a sample of 27,890 middle-aged adults, reported that 54.5% of the total duration of wear was spent on SB, with MPA and VPA accounting for 5.4% and 0.1%, respectively [20]. However, VPA contributes more to energy expenditure than other types of PA and is an independent factor in improving cardiorespiratory fitness and reducing morbidity and mortality.
This study analyzed the factors associated with adherence to MVPA and SB guidelines in South Korea. Meeting these guidelines contributes to the prevention of metabolic diseases and reduction in mortality [2,17,29]. Therefore, it is important to investigate the independent health benefits associated with meeting each guideline. However, recent studies have reported that meeting one guideline may offset the health benefits of not meeting another. For example, even if the MVPA recommendation of 150 min/week is met, increased SB can cancel out its positive effects and increase the risk of disease and mortality [30-34]. These findings suggest that increasing MVPA and reducing SB in daily life are important. Our previous research suggested that replacing 30 minutes of SB with MVPA reduced the risk of cardiometabolic disease by 23% [18], indicating the need for public health interventions to meet MVPA and SB guidelines in Korea.
This study extends the knowledge gained from previous studies by analyzing the demographics, lifestyles, and health statuses of the participants. Sex, age, education, household income, occupational status, alcohol consumption, smoking, and multimorbidity were assessed as factors associated with adherence to the two guidelines. In line with previous studies, our findings demonstrated that women had a lower OR for adhering to MVPA guidelines than men. Moreover, middle-aged and older adults were more likely to adhere to the MVPA guidelines than those aged 20-39 years. Additionally, individuals with higher household incomes were more likely to adhere to the MVPA guidelines, which was consistent with literature reports on the association between socioeconomic status and health-related lifestyle behaviors, including PA.
Our study further revealed that blue-collar workers were less likely to adhere to the MVPA guidelines and more likely to adhere to the SB guidelines. This suggests that occupations in the blue-collar sector tend to involve physically demanding tasks but may be less conducive to planned PA. Notably, blue-collar workers had the lowest levels of SB and MVPA but the highest levels of light-intensity and lifestyle activities. Consequently, targeted health promotion programs should be developed to encourage PA participation, specifically within this demographic group.
Individuals who were current smokers, had excessive alcohol consumption, or suffered from multimorbidity were less likely to adhere to the MVPA-SB guidelines. These findings suggest that unhealthy lifestyles in the general population are multifactorial rather than singular. Therefore, they require an integrated health education approach in addition to increased PA. These trends may be more prevalent in the lower socioeconomic groups.
Our results show that SB is prevalent in modern societies and many adults find it challenging to adhere to PA guidelines. Our study provides detailed information on PA and SB patterns in Korean adults, as well as the factors associated with adherence to PA guidelines. The shift towards a more sedentary lifestyle in modern societies may be responsible for the high prevalence of SB and low adherence to PA guidelines. Technological advances and changes in transportation, work, and leisure activities have decreased PA and increased SB. This trend may have particularly strong implications for adults who often have busy work schedules and limited time to engage in PA.
These results have significant implications for public health policies and interventions. Strategies to promote PA and reduce SB, including community health promotion programs, community-based PA programs, and policies promoting active transportation, should incorporate the factors associated with adherence to PA guidelines, such as age, sex, income, education, health-related behaviors, and health status.
This study provided objective and reliable data via the use of accelerometers to measure PA and SB. The large sample size (>2,000 participants) increased the generalizability of our findings to the Korean adult population. Moreover, the inclusion of different types of PA and SB patterns (light-intensity activity, lifestyle activity, MVPA, and SB) allowed for a comprehensive assessment of PA behavior. In addition, this study investigated various factors associated with adherence to PA guidelines, providing insights into potential targets for interventions to increase PA.
One major limitation of out study was its cross-sectional design, and the causal relationships between PA behaviors and their associated factors were not established. Additionally, this study relied on a single measurement of PA and SB, which may not fully capture the typical behaviors of individuals. It should be noted that the present study did not incorporate data on engagement in strength training, which is recommended by the PA guidelines. Thus, future research focusing on MVPA guidelines should include strength training to enhance our understanding of this topic. Another limitation is the potential for selection bias, as individuals who agreed to the accelerometer measurements may have had different PA levels than those who did not. Finally, the study included only Korean adults, limiting the generalizability of the findings to other populations.
Our study provides valuable insights into the patterns of PA and SB in Korean adults and the factors associated with adherence to PA guidelines. Most Korean adults do not adhere to the internationally recommended MVPA-SB guidelines, which poses a major public health concern. These findings highlight the need for public health policies and interventions to promote PA and reduce SB, especiallyly among adults facing time constraints and other limitations.
Acknowledgements
This work was supported by the R&D Program for Forest Science Technology (grant number 2021410D10-2325-0101) provided by the Korea Forest Service and the Korea Institute of Marine Science & Technology Promotion (KIMST) funded by the Ministry of Oceans and Fisheries (grant number G22202200272201).
The authors declare no conflicts of interest.